Energy, Work, and the Case for Judging AI Infrastructure
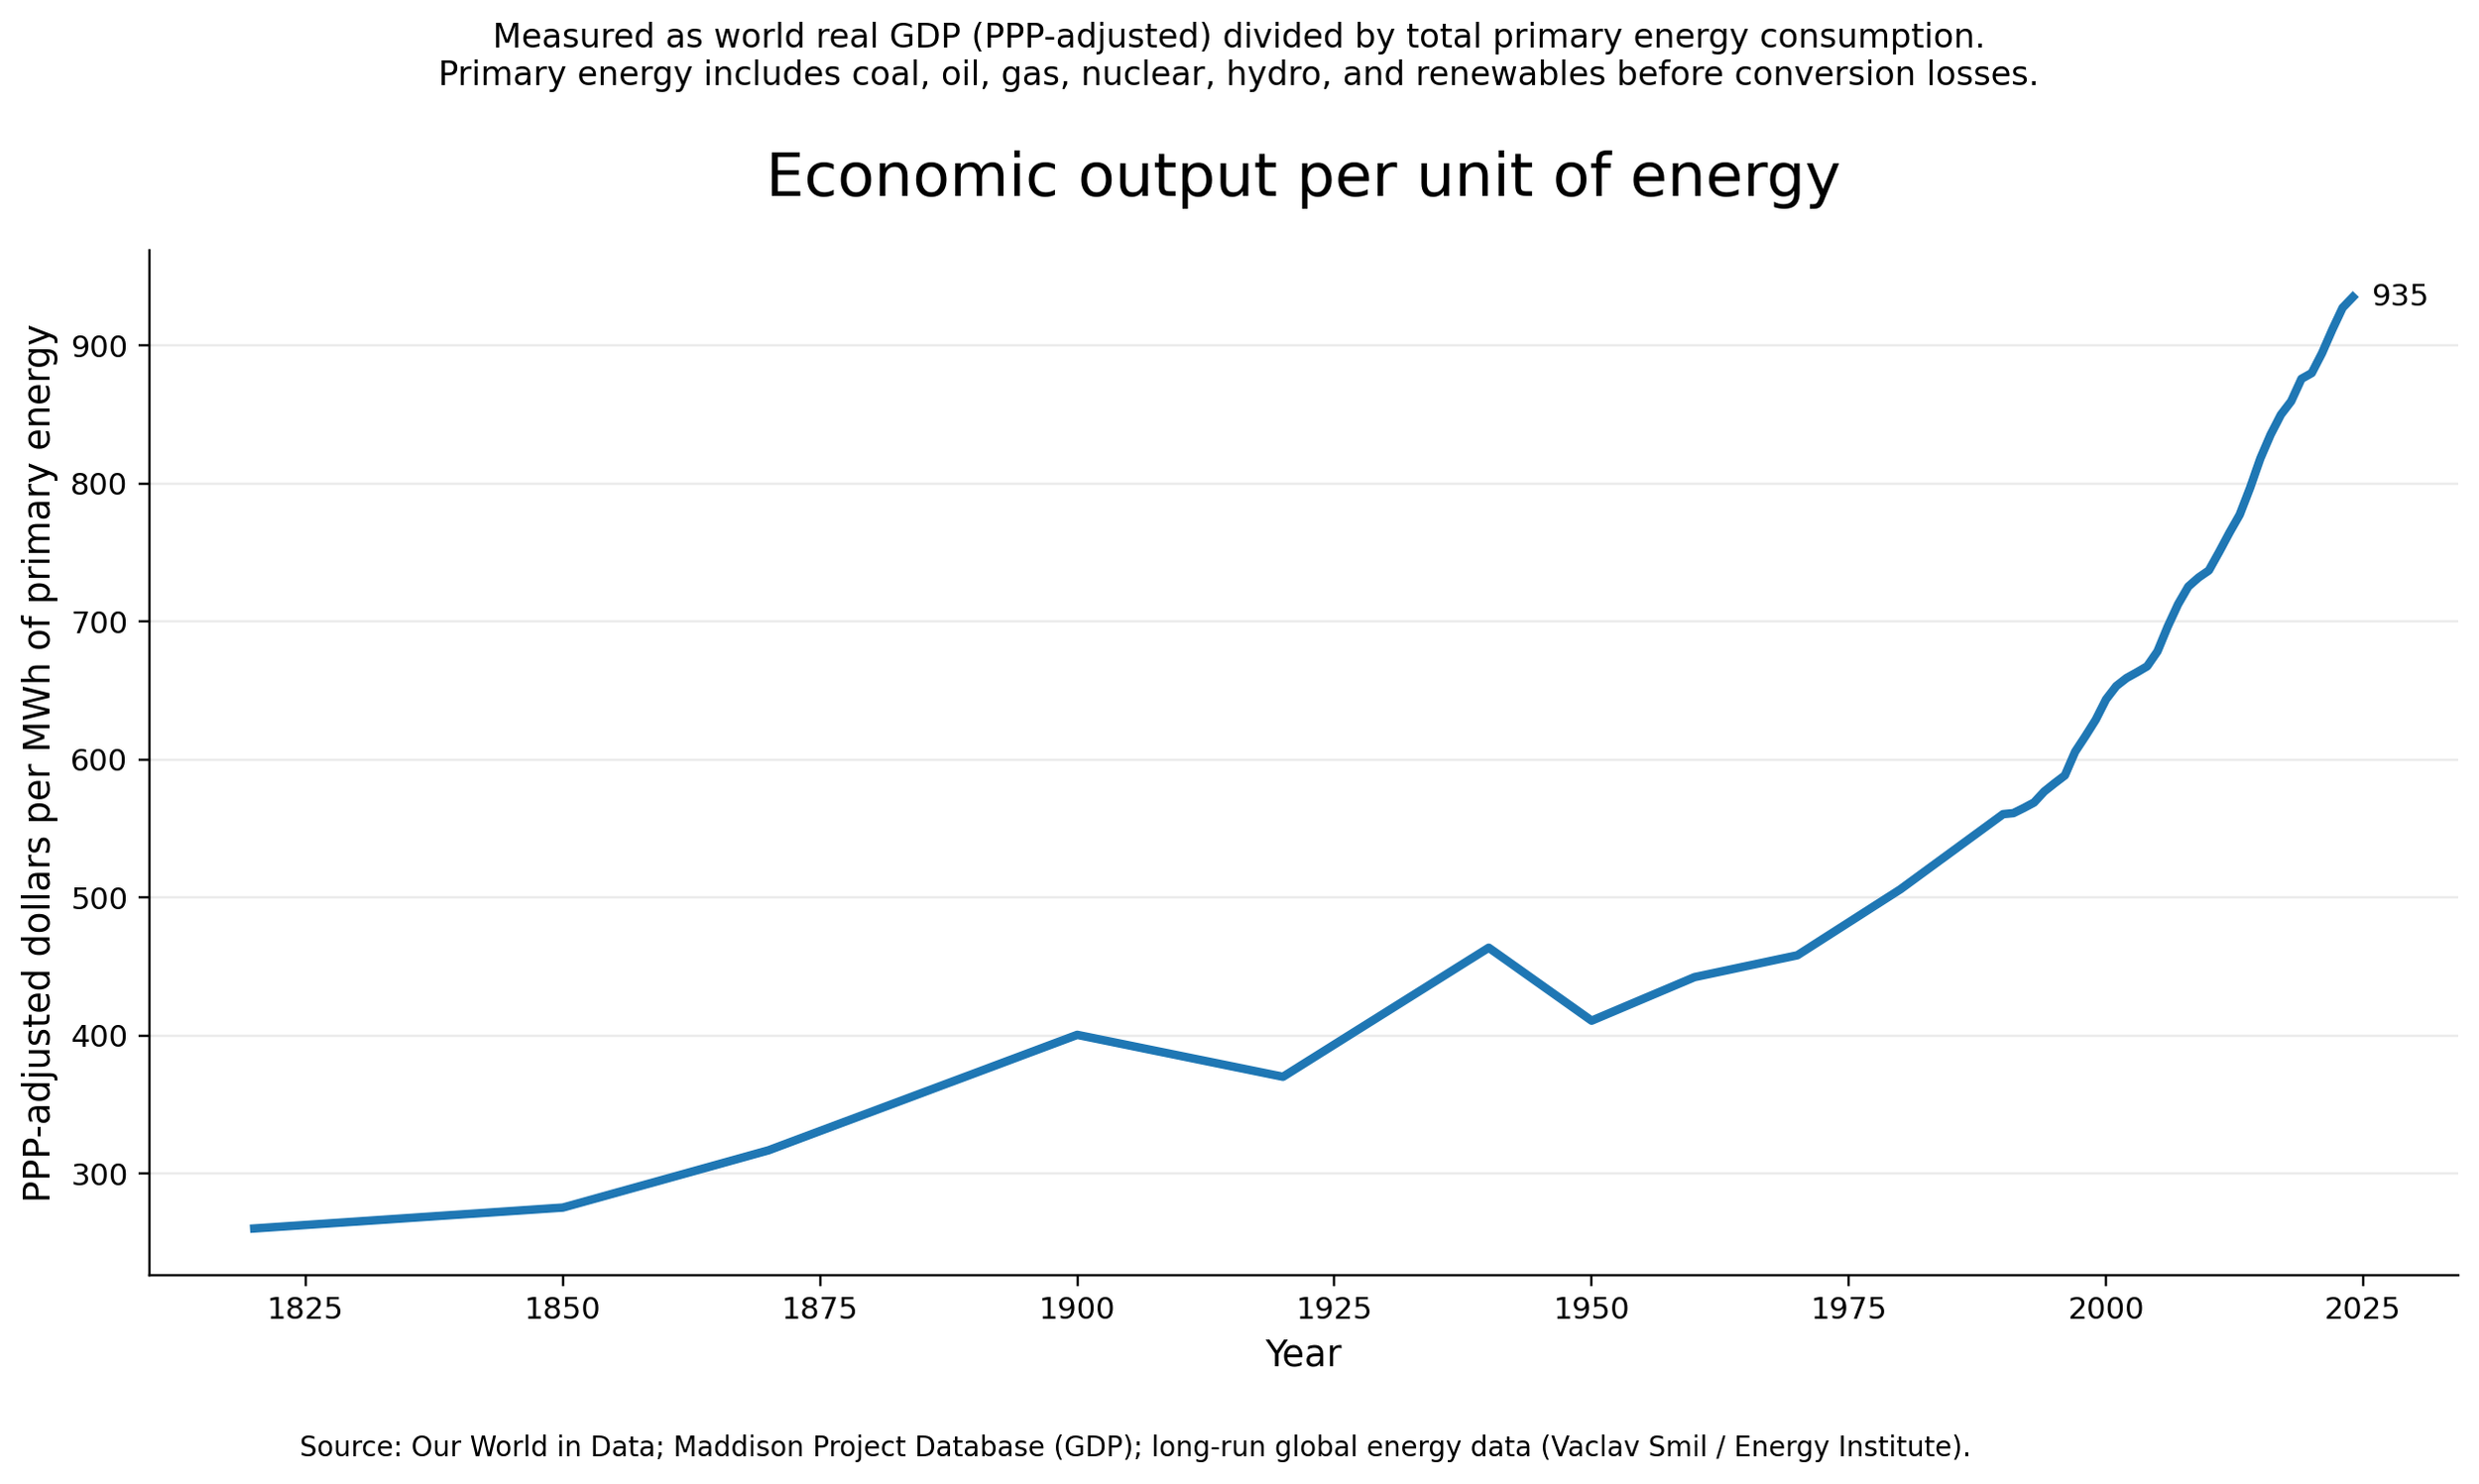
Figure A. Economic output per unit of energy, world (1800–present).
Over the long run, global economic output per unit of energy has increased substantially. Despite large increases in total energy use, each unit of energy supports more economic activity than in the past, reflecting improvements in technology, infrastructure, and organization.
The environmental debate around AI infrastructure usually reaches for the wrong metric too early. Raw energy use, water use, or prompt-level arithmetic do not answer the question people are actually trying to ask. They describe inputs. They do not tell us what work is being done, what waste is being displaced, whether the system is becoming more efficient, or which burdens are inherent versus subject to engineering and governance.
Four questions keep the scale straight. How much useful work is delivered per unit of energy. Whether the unit of work is being measured correctly. Whether the system is moving toward higher output per unit over time. And which externalities are fixed versus those that can still be changed through siting, cooling design, grid planning, disclosure, and cost allocation.
The unit of work is not fixed. A prompt, a task, a workflow, and an organization’s output are different units, and they produce different ratios. A prompt-level view makes compute look expensive. A task or workflow view can show substitution and time savings. A firm-level or economy-level view can show coordination gains and higher output from the same effort. The answer changes with the level you choose, which is why the unit has to be stated before drawing conclusions.
AI infrastructure sits inside that frame. It does not arrive as a single prompt. It arrives as industrial systems: substations, interconnection queues, cooling systems, land use fights, rate cases, water sourcing, generator permits, and regional grid forecasts. That is the level on which its costs become legible.
The missing standard
The footprint is substantial. Data centers now account for a little over 1% of global electricity use and roughly 0.5% of global CO2 emissions. In the United States, they used about 4% of national electricity in 2023, with some projections suggesting 7% to 12% by 2028 as AI demand grows. GPT-3 training is often cited at roughly 1,287 MWh and about 552 tons of CO2. Ireland’s data-center share rose from about 2% to 11% of national grid capacity over the past decade. [1][2][3] Those figures are large enough to take seriously. They still do not answer whether the bargain is good or bad.
Megawatt-hours and gallons show scale. They do not show what the system produces, what it replaces, or whether the trade is worth it.
The missing standard is energy per unit of useful work. This is the measure most arguments are trying to get at: how much output you get for the energy you spend. Raw consumption can establish scale. It cannot decide whether the bargain is good, bad, improving, or getting worse.
The difficulty is obvious. Useful work is harder to count than electricity or water. It is easier to total megawatt-hours than to say what kinds of output are relevant, how much value a system created, or how much older waste it displaced. That measurement problem is substantive. It reinforces the need for a clear standard and calls for stating it carefully.
Energy use can rise before efficiency improves
In Britain, the early industrial transition appears to have expanded the energy base first, with output per unit of energy recovering later. This field note traces that pattern.
Britain’s output per unit of energy, 1700–1950
Output per unit of primary energy falls through the long buildout of the industrial system, then begins to recover later. The early transition looks energy-hungry before it looks efficient.
At civilization scale, GDP per unit of primary energy serves as a rough proxy for that relationship, using an economy-level unit of work rather than a prompt or task. It provides a normalized metric that extends across long historical periods, which makes comparisons possible in a way few other measures do. It is a blunt proxy, and its limits are material. GDP misses distribution, quality, unpaid work, badly priced goods, and large categories of social value that markets only capture imperfectly. But it still shows something important across long time horizons: industrial societies have repeatedly learned how to generate much more output from each unit of energy than they did before.
Figure A tracks that ratio directly. Economic output per unit of energy rises from roughly 260 PPP-adjusted (purchasing power parity) dollars per MWh in the early nineteenth century to about 935 today, with interruptions and reversals along the way. GDP does not legitimize every new load on the grid. Over the long run, the bargain has been judged by output per unit of energy rather than raw energy use alone.
The pattern is not smooth. The line includes reversals, plateaus, and periods of strain rather than a frictionless story of progress. Industrial systems are often materially awkward in their early phases. That history does not prove this buildout is justified or that it will follow the same arc. It does show something narrower: raw energy growth alone is too weak a metric for judging general-purpose infrastructure.
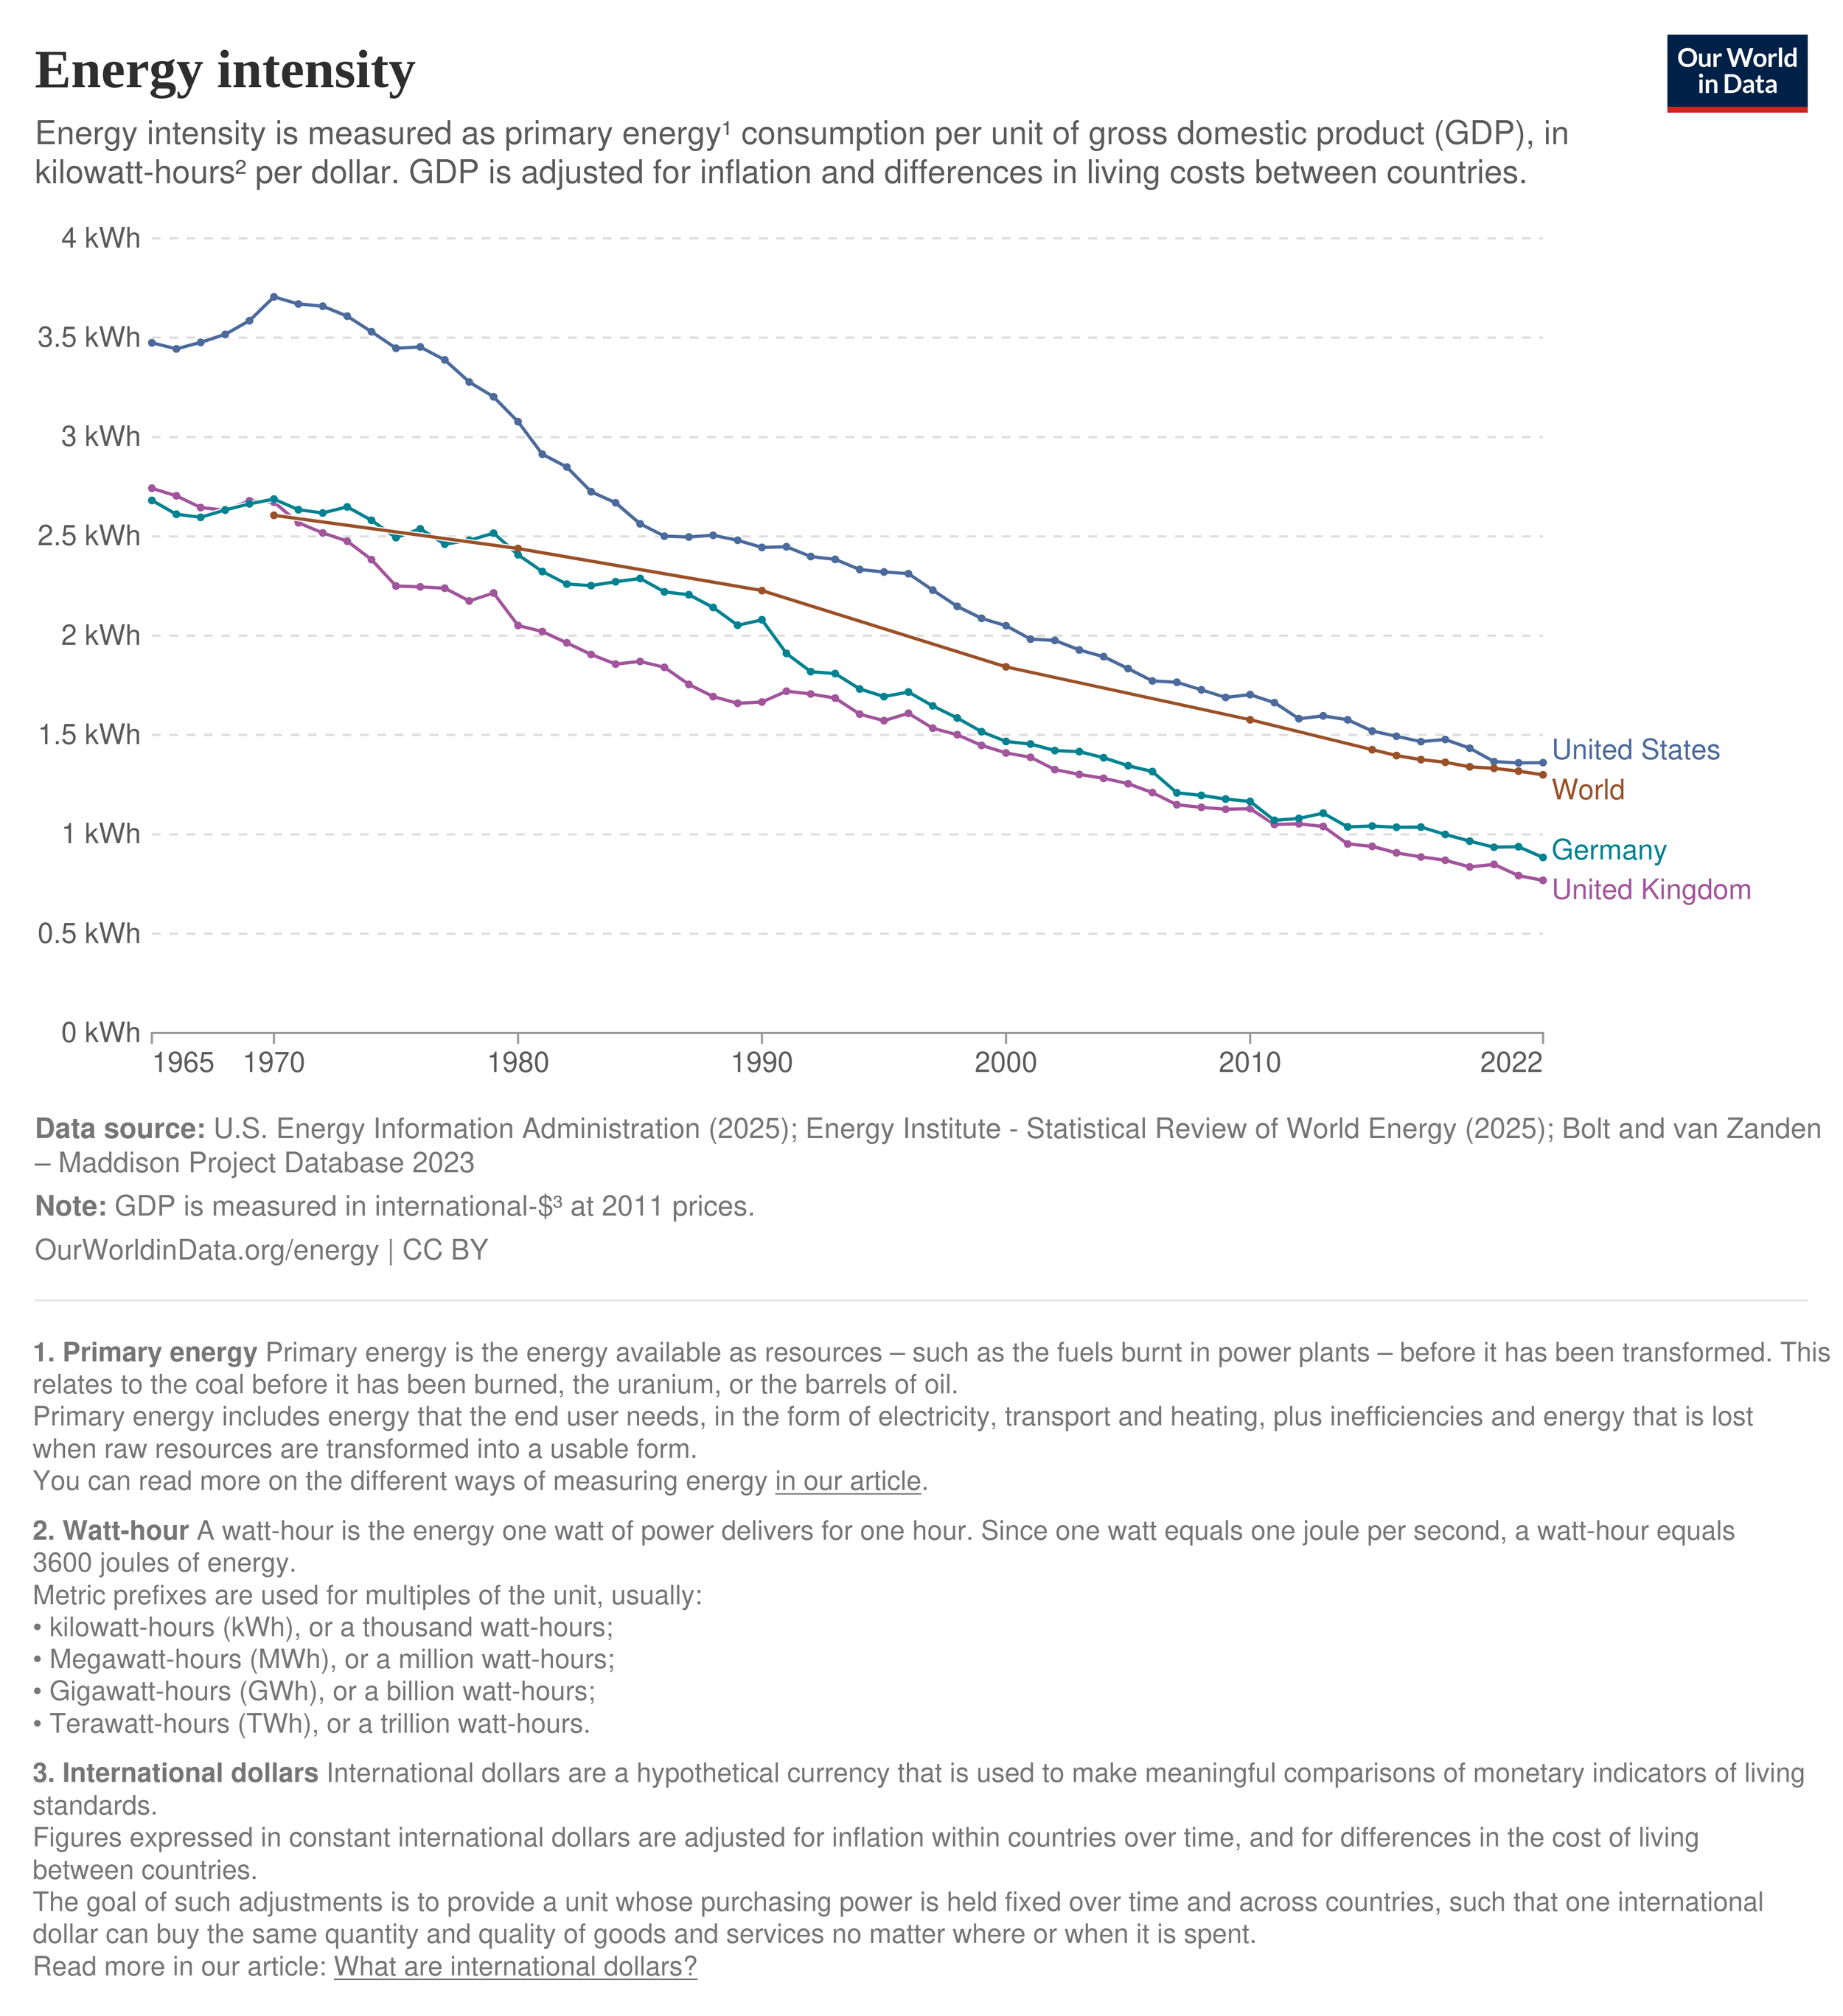
Figure B. Energy intensity of major economies (1965–2022)
Energy use per unit of economic output has steadily declined across advanced economies and globally. This is the inverse of the long-run pattern shown above: as societies develop, they produce more economic output for each unit of energy consumed.
Early burden therefore does not settle the long-run question by itself. It raises the burden of proof on governance, local terms, and measurable productivity. The relevant question is whether the system is moving toward more useful output per unit of energy while the burdens are being governed honestly rather than displaced.
In many enterprise cases, the baseline is not no compute at all, but older fragmented systems, duplicated local overhead, low utilization, poorer cooling, or labor-intensive workflows. Shared industrial-scale systems change that equation. Hyperscale and cloud platforms pool demand across many users, smooth load across time, amortize expensive model development across very large populations, and keep more of the installed base doing work for more of the day. A shared platform serving many kinds of workloads can push utilization much higher than isolated enterprise hardware sized for peak demand and left idle the rest of the time.
That still does not make every increment of new demand self-justifying. Some of this buildout substitutes for older waste. Some of it enables capabilities that smaller isolated systems could not provide efficiently. The point is narrower. Novelty alone is the wrong test. The question is whether the overall system produces enough useful work, enough substitution, enough efficiency improvement, and enough social value to justify its load and local burdens.
Before the cloud, most enterprises ran their own racks. Rooms sized for peak load sat mostly idle, especially outside business hours. Capacity was provisioned for worst case and then left unused. Cooling was uneven, hardware refresh was slow, and utilization often hovered in the low single digits.
Cloud platforms changed that. Many customers share the same fleet. Load varies by time of day and by workload, so aggregate demand is smoother. Autoscaling adds capacity when traffic spikes and releases it when it falls. The same servers that handle retail peaks can serve video at night or batch jobs off-peak. Providers also replace hardware more frequently than most enterprise IT shops.
That shift raised utilization and cut idle overhead. More of the installed base spends more of the day doing useful work. Newer, more efficient machines enter the fleet sooner. Compared with the earlier model of mostly idle enterprise hardware, the result is more compute from the same physical base.
Useful work has to be defined narrowly enough to survive criticism, and at a stated level of measurement. Replacing inefficient compute counts. Compressing labor time in real tasks counts. Improving coordination in logistics, maintenance, cooling, forecasting, routing, or grid response counts. Serving large numbers of people or institutions through shared infrastructure can count. A workforce that produces more with the same effort can justify higher energy use per worker if output rises faster than the load behind it. Willingness to pay is not enough by itself. The standard has to point to substitution of higher-cost or higher-waste processes, demonstrable quality gains, or service expansion that is legible outside the seller’s revenue line.
A compact measurement ladder helps. At the workload level, compare task completion, latency, quality, and substitution against incumbent methods. At the organizational level, compare labor hours, error rates, throughput, or service expansion. At the infrastructure level, compare utilization, cooling and power efficiency, and carbon intensity in context. At the policy level, compare cost internalization, additional capacity, and enforceable local benefits.
The measured productivity evidence is still suggestive, but it is less anecdotal than it was a year ago. By August 2025, 37.4% of employed U.S. respondents reported using generative AI at work, and the associated time savings had reached 1.7% of total hours worked.[10] Earlier 2024 estimates put direct assistance at roughly 0.5% to 3.5% of U.S. work hours and possible labor-productivity gains at about 0.1 to 0.9 percentage points under then-current adoption levels.[9] Task-level evidence is clearer than macro evidence. In one widely cited experimental setting, access to generative AI reduced time spent on midlevel professional writing tasks and improved output quality, with larger gains among lower-performing workers.[8]
Cost and capability are moving on a separate curve. The cost of querying a model performing at GPT-3.5 level on the Massive Multitask Language Understanding benchmark fell from $20.00 per million tokens in November 2022 to $0.07 per million tokens by October 2024, a drop of more than 280×.[7] Cheaper access to capability is not the same thing as socially useful output. It does mean the efficiency side of the system is changing fast, which makes static burden arithmetic less reliable than critics often assume.
Externalities, siting, and who pays
The externalities differ in weight, scale, and how much control anyone still has over them.
The first tier contains the most decision-relevant harms: local grid strain, interconnection bottlenecks, water in stressed regions, land-use conflict, noise, backup generation, secrecy, and cost allocation. These are the points at which projects become politically unstable or substantively unacceptable. They are also the harms most directly shaped by siting, engineering, disclosure, and public bargaining.
Land use belongs here in a more specific sense than the phrase usually gets. Some projects take green space that communities want to preserve. Some intensify housing pressure or conflict with other local priorities. Those are different problems. A town may accept one and reject another. The remedy is usually equally specific: denser siting, better buffers, habitat offsets, infrastructure commitments, or housing funds tied to the project rather than generic promises about growth.
A second tier contains harms that are significant but often misweighted. Carbon burden belongs here because it is heterogeneous. It cannot be inferred from compute load alone. Grid mix, timing, marginal emissions, displacement, and additionality all change the result. E-waste belongs here too. The material throughput is substantial, especially with rapid hardware turnover, but AI infrastructure is still part of a broader electronics-waste stream and should not be treated as though it were the dominant source of global tech waste. The practical question is whether refresh cycles come with secondary uses, recovery requirements, and recycling built into the cost of the system.
A third tier contains the weakest frames: prompt-level guilt metrics, symbolic comparisons between AI use and flights or memes, and analogies that treat AI as merely the new crypto. They spread because they turn a complicated system into a vivid personal number. The simplification is the appeal. It is also the weakness.
Water has to be held in two scales at once. In aggregate terms, data-center water use remains modest relative to agriculture or municipal demand. Google has cited roughly 4.3 billion gallons of annual water use across its global data centers, about the same as 29 golf courses in the American Southwest.[4] That comparison does not rescue a bad site, but it does restore proportion. Public rhetoric often treats any visible consumption by AI infrastructure as exceptional. At the same time, local burden carries more weight than aggregate modesty. A facility in a stressed basin can still be a bad project even if the sector remains small in national totals.
Siting data makes that plain. A large share of data centers already operate in high water-stress regions, and many recent U.S. builds have landed in states with serious water pressure. The differences across projects are not cosmetic. A facility drawing potable water in a stressed basin is a different burden than one using reclaimed wastewater. An evaporative system imposes a different load than a closed-loop or immersion design. Those choices determine how much water is actually consumed and who bears the cost.
Location is constrained by more than climate. Latency, existing fiber and substation access, land cost, and tax treatment all shape where projects land. That limits how often operators can simply “move to a better place.” The relevant question is specific: this facility, in this watershed, using this design, under these sourcing and disclosure terms.
The engineering choices are not incidental here. Operators are already using recycled wastewater, canal water, seawater, stormwater capture, and newer liquid-cooling systems that reduce lifecycle burdens relative to older air-cooled setups. AWS reported a global average water usage effectiveness of about 0.15 liters per kilowatt-hour in 2024. Some next-generation liquid cooling and immersion systems are estimated to cut lifecycle greenhouse-gas impacts by roughly 31% to 52% relative to conventional air cooling, while some newer Microsoft designs aim for very low or zero water use.[5][6] None of that erases site-specific harm. It does show that part of the burden remains a design choice rather than a fixed property of computation.
Grid pressure reflects demand growth and institutional lag. The grid is public infrastructure even when utilities and generators are privately owned. Utilities are often reluctant to invest ahead of demand without clear cost-recovery approval. Transmission takes years. Substations fill up. Interconnection queues grow. A large majority of queued U.S. generation is carbon-free, yet most queued projects are withdrawn before construction and only a minority get built. That is not a natural law. It is a mix of regulatory inertia, capital constraints, queue dysfunction, and planning failure.
This is where a lot of the public argument becomes blurry. People talk about “the grid” as if it were a fixed environmental limit, when much of the actual bottleneck sits inside utility regulation, cost recovery, permitting, and sequencing. A region can have plenty of theoretical generation in development and still be unable to serve a large new load on time. It can have capital available somewhere in the system and still lack approval to spend it where expansion is needed. It can have abundant proposed clean generation and still fail to connect it fast enough to be consequential. The limit is often institutional before it is physical.
New large loads can trigger infrastructure upgrades that might otherwise stall. Transmission, renewable generation, storage, and substation capacity often become easier to justify once demand is certain. Whether that is beneficial depends on timing, cost allocation, and who captures the gains. Rural regions can end up with infrastructure they would otherwise wait years to secure, but that upside only counts when the terms are explicit.
Cost allocation is part of the environmental question. If a project requires new generation, substations, transmission, and local infrastructure, the data center operator should carry a large share of that cost.
In contract terms: Rate neutrality for residents over a defined period. The operator funds required upgrades through upfront contributions or binding tariffs. Long-term power purchase agreements tied to new capacity rather than existing supply. Escrow or security for overruns. No default socialization of costs onto retail customers. The same logic extends beyond electricity to roads, fire coverage, sewer expansion, and water-system offsets when the project requires them.
But this is not one-sided. Choosing whether and how to host concentrated digital load is part of governing local economic development, infrastructure planning, and future capacity. That choice is not costless in either direction. Accepting growth without discipline can socialize burdens and distort local priorities. Refusing growth, or failing to plan for it, can mean forgoing investment, infrastructure improvements, and other forms of commercial activity a community may or may not value.
The structure is a partnership. Operators fund and guarantee the load they introduce. Communities set terms, plan capacity, and decide what kind of growth they will accept. Brownouts and degraded service for residents are unacceptable, which is why backup power and reliability support need to be part of the operating plan rather than left to improvisation. The relevant question is what terms are acceptable, who pays, what benefits are enforceable, and what trade-offs the community is willing to make.
Responsibility sits upstream. End users do not choose the cooling architecture, the interconnection queue, the transformer backlog, the utility rate design, or the water source. They do not decide whether a facility uses reclaimed water, contributes to grid upgrades, or socializes its costs through ordinary bills. Operators, utilities, regulators, and large infrastructure buyers make those decisions. That is where scrutiny belongs.
Prompt-level guilt therefore misses the real lever. The underlying move is familiar: turn a system-level burden into a personal purity test. People get told to think twice before asking for a draft revision, generating an image, or using AI for routine research because each interaction can be assigned a large number for water or power. That pressure lands on the wrong actor. Evaluate the systems being built by whether they are efficient enough, disclosed clearly enough, and governed honestly enough to justify the burdens they impose. If they fall short, communities can require better terms.
The test
The hardest objections persist. Efficiency gains can increase total demand rather than reduce it. Some use cases will be trivial or manipulative. Productivity claims can be overstated. “AI for climate” rhetoric can become greenwashing attached to a real upstream footprint. And a globally efficient system can still be locally intolerable if the project is badly sited or the bargain is opaque.
Those objections are part of the test. The standard is simple to state: judge the system by what useful work it produces per unit of energy, what older architecture it replaces, whether that ratio is improving over time, and whether local burdens are disclosed, negotiated, and fairly allocated. Raw consumption and boosterism both fail because they do not answer those questions.
The practical question is no longer whether advanced digital infrastructure should exist. It already underwrites economic and institutional life, and AI is becoming part of that foundation. The question is whether this next layer is built badly or well, blindly or accountably, with socialized burdens or disciplined cost allocation, with vague promises or enforceable terms. A politics of refusal confuses infrastructure governance with infrastructure abstinence. The choice is whether to shape this buildout on rational public terms or leave it to delay, opportunism, and avoidable conflict.
Selected source notes
[1] Carbon Brief: “AI: Five charts that put data-centre energy use – and emissions – into context.” https://www.carbonbrief.org/ai-five-charts-that-put-data-centre-energy-use-and-emissions-into-context/
[2] DOE: “DOE Releases New Report Evaluating Increase in Electricity Demand from Data Centers.” https://www.energy.gov/articles/doe-releases-new-report-evaluating-increase-electricity-demand-data-centers
[3] Scientific American: “A Computer Scientist Breaks Down Generative AI’s Hefty Carbon Footprint.” https://www.scientificamerican.com/article/a-computer-scientist-breaks-down-generative-ais-hefty-carbon-footprint/
[4] Trellis: “Sip or guzzle? Here’s how Google’s data centers use water.” https://trellis.net/article/sip-or-guzzle-heres-how-googles-data-centers-use-water/
[5] AWS: “AWS Cloud - Amazon Sustainability.” https://sustainability.aboutamazon.com/environment/the-cloud
[6] Microsoft: “Sustainable by design: Next-generation datacenters consume zero water for cooling.” https://blogs.microsoft.com/blog/2023/08/16/sustainable-by-design-next-generation-datacenters-consume-zero-water-for-cooling/
[7] Stanford HAI: “The 2025 AI Index Report.” https://aiindex.stanford.edu/report/
[8] Science: “Experimental evidence on the productivity effects of generative AI.” https://www.science.org/doi/10.1126/science.adj0998
[9] Equitable Growth: “What impact is artificial intelligence having on the U.S. labor market and the nation’s economy?” https://equitablegrowth.org/what-impact-is-artificial-intelligence-having-on-the-u-s-labor-market-and-the-nations-economy/
[10] Harvard / St. Louis Fed: “Generative AI Adoption Tracker.” https://pw.hks.harvard.edu/post/the-generative-ai-adoption-tracker