Five Figures on Fertility
I started this work from a suspicion that the fertility story was being told through too few variables. The new U.S. figures arrived after years of watching the cost of raising a child move from difficult to punishing, with Brookings putting the inflation-adjusted cost of raising a child to age 17 at about $310,605 for a middle-income family. Last year, South Korea was back in the headlines as the country most visibly living through the consequences of prolonged ultra-low fertility, even with a small rebound to 0.75 in 2024 from 0.72 in 2023. At the same time, the labor picture has started to soften in sectors that were supposed to define the next economy. TechCrunch, citing Layoffs.fyi, reported more than 150,000 tech job cuts in 2025, and Challenger tracked 54,836 layoff announcements that employers explicitly tied to AI during the year. None of that proves a single causal chain. It does make the setting harder to dismiss. Children are expensive, the path to stable adulthood is taking longer, the job market feels less secure at the margin, and the same period is filled with confident talk about AI, abundance, and longer lives. That combination is what pulled me back to the fertility data.
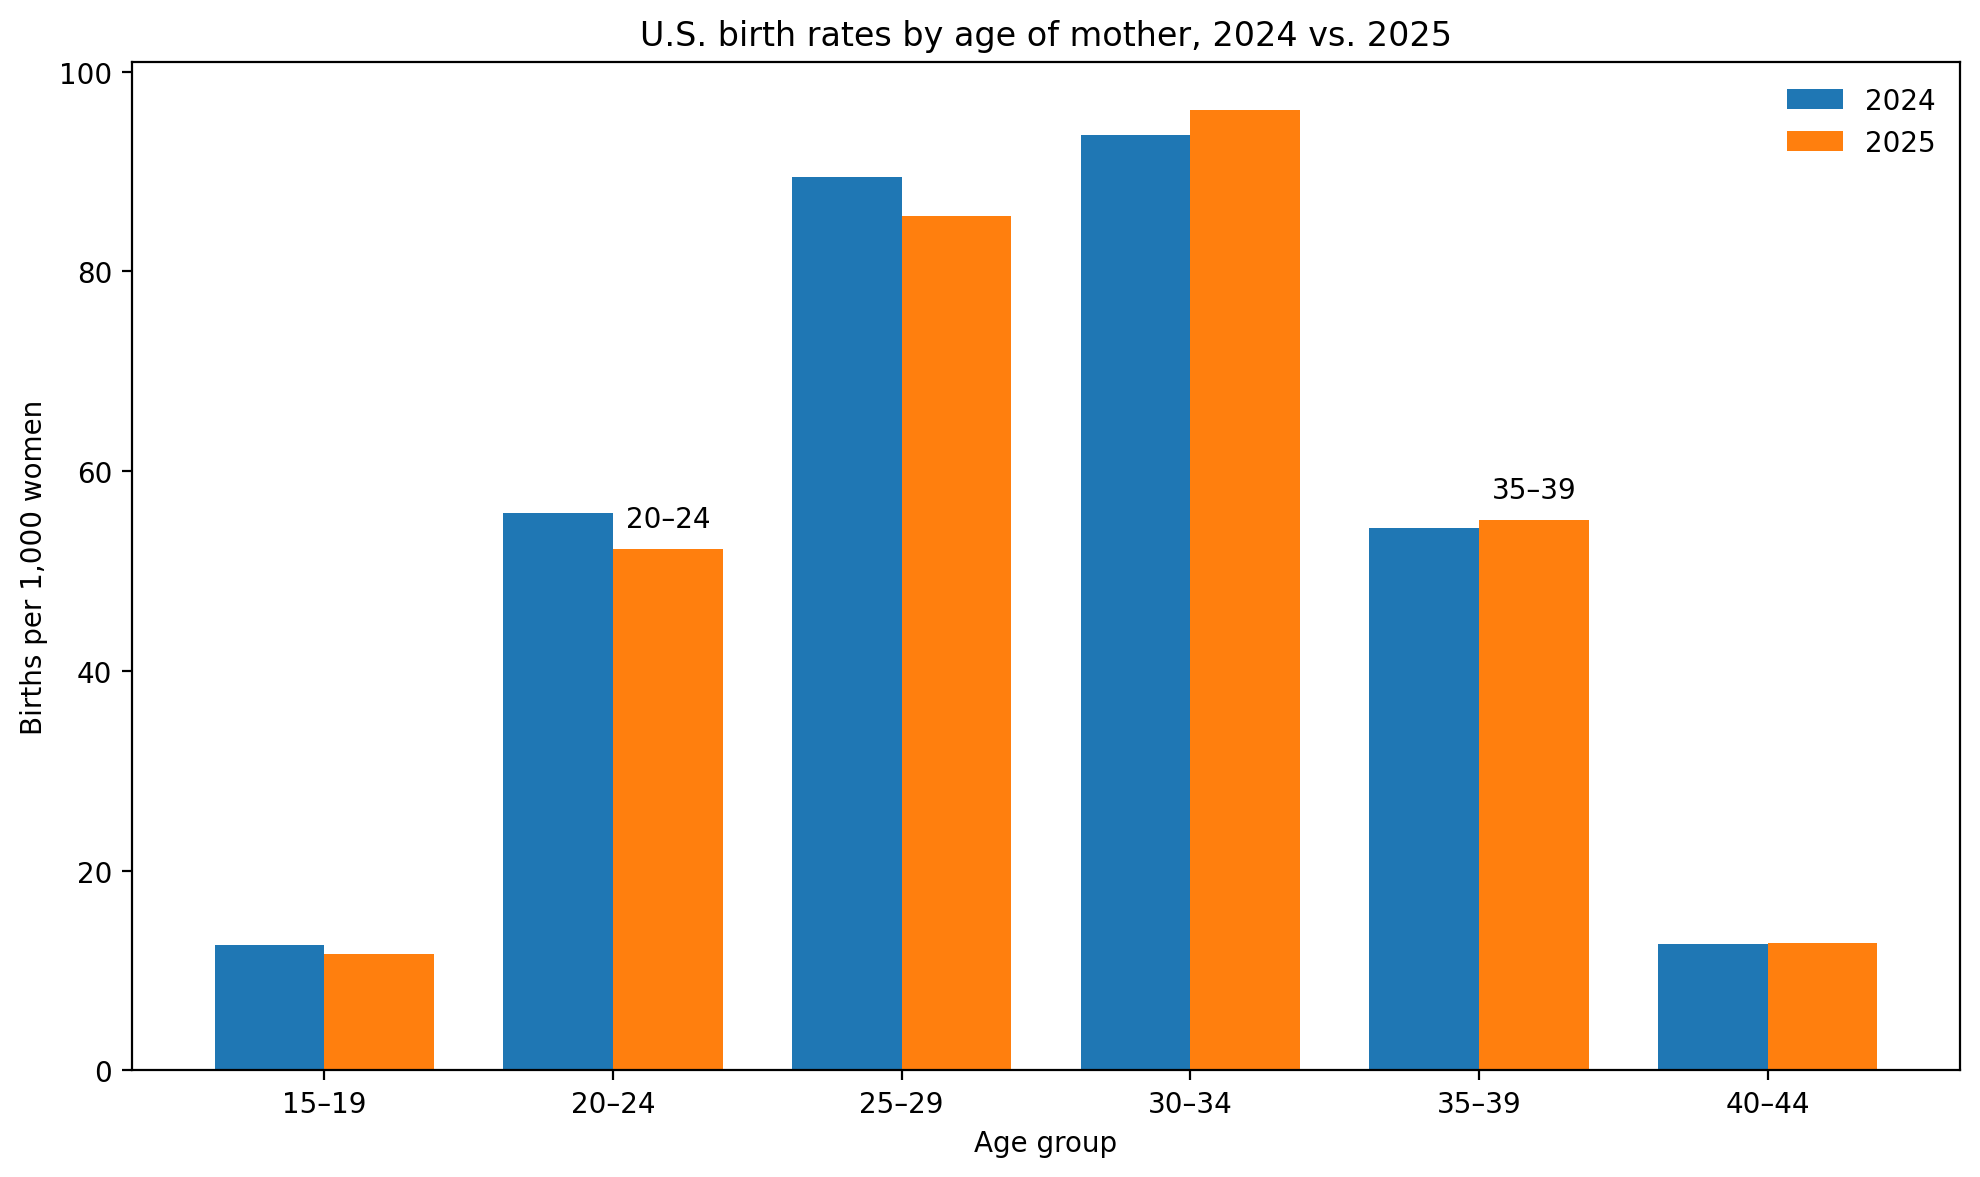
Fig. A. U.S. birth rates by age of mother, 2024 vs. 2025.
Source: Centers for Disease Control and Prevention, National Center for Health Statistics, National Vital Statistics System. Births: Provisional Data for 2025 (Vital Statistics Rapid Release, Report No. 43), released April 9, 2026.
Fig. A is the most evident the set because it catches the shift in one glance. In 2025, the birth rate for women ages 35 to 39 moved above the rate for women ages 20 to 24. Many societies can postpone childbearing for a long time and still assume the delay is manageable. This chart suggests the shift has gone far enough to raise a harder question: how much of that delay can be absorbed before biology starts narrowing the available margin
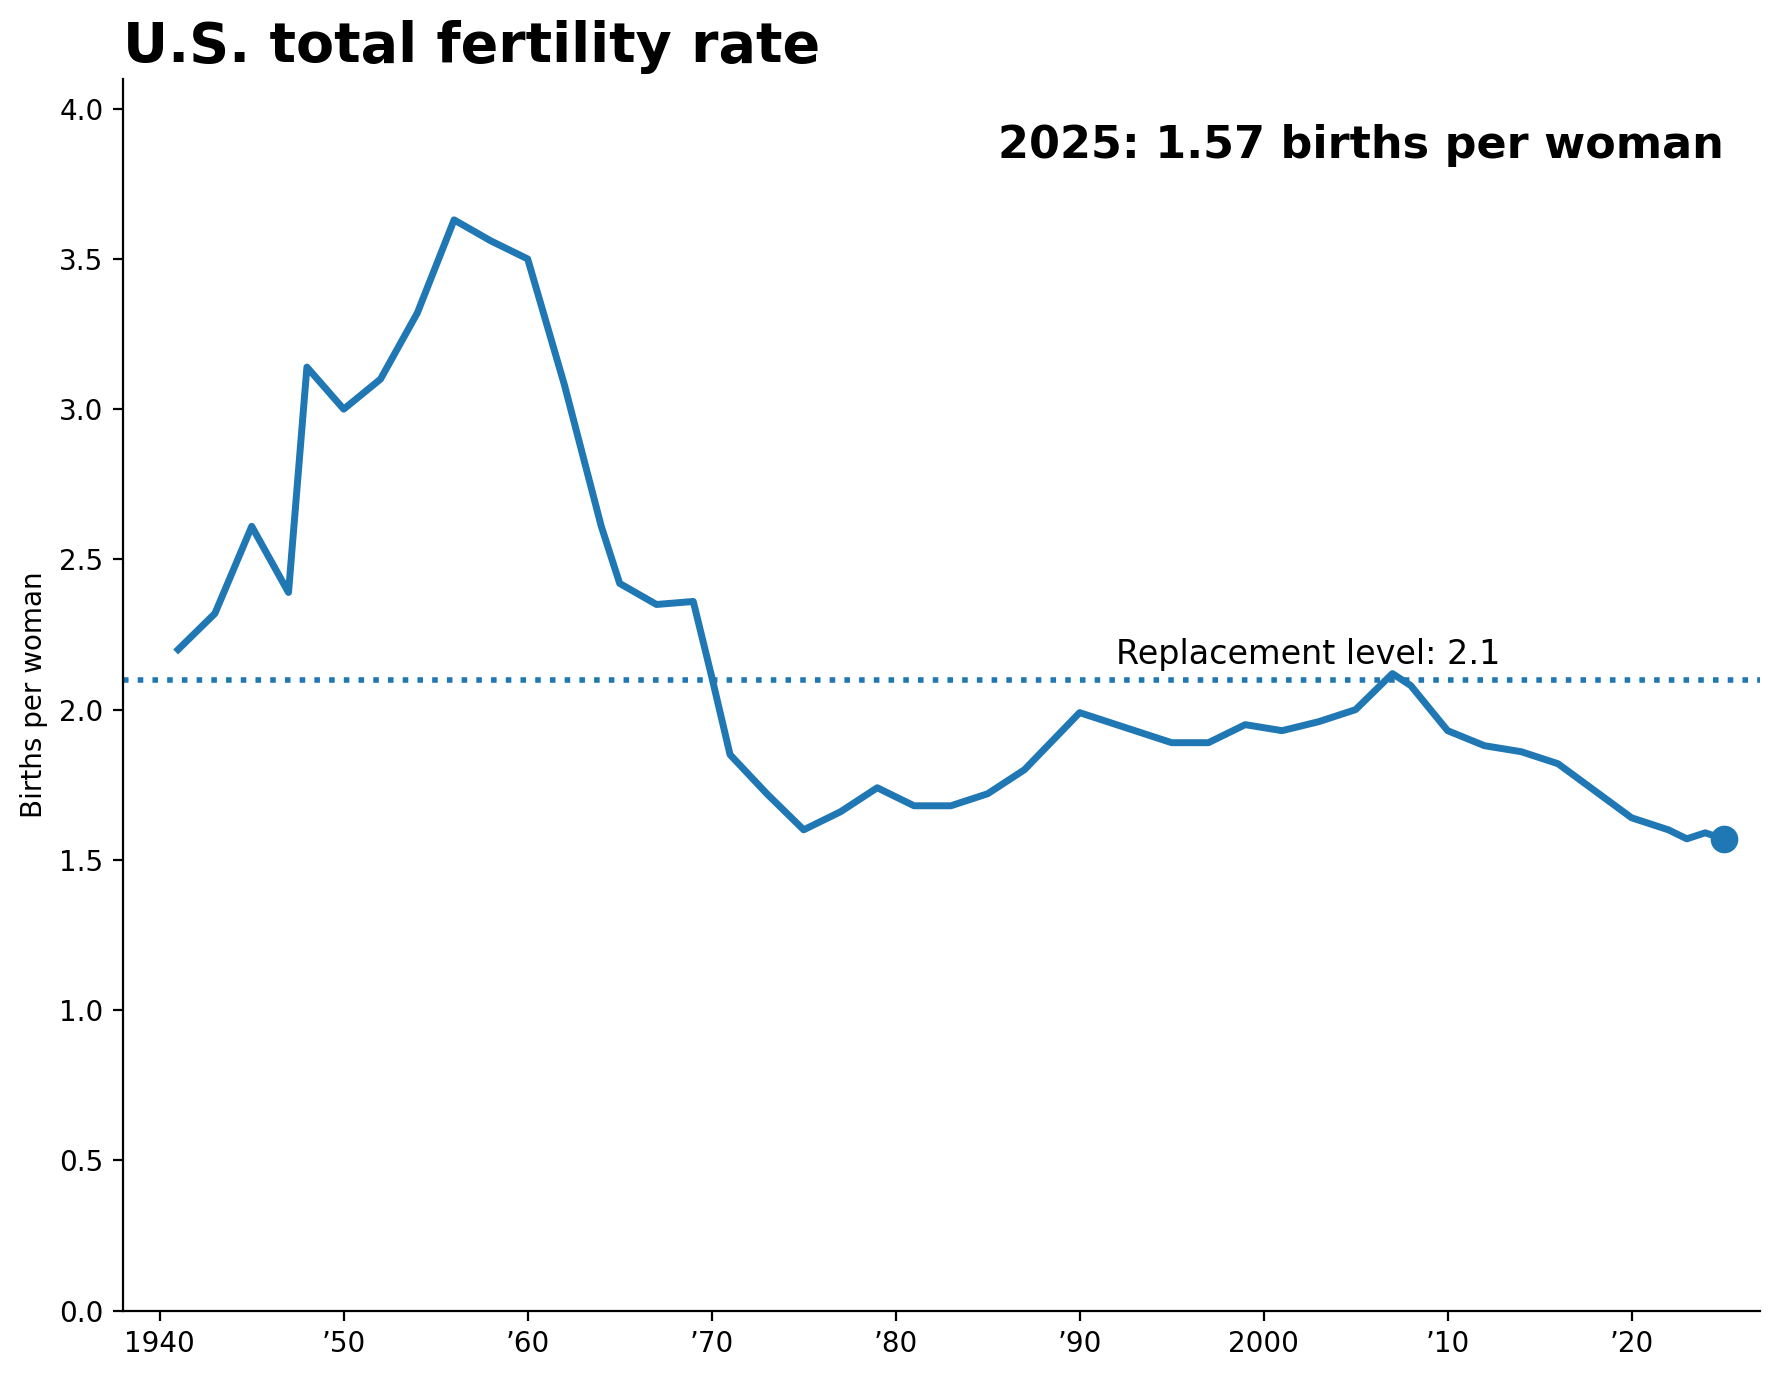
Fig. B. U.S. total fertility rate, 1941–2025.
Source: Historical series based on Galofré-Vilà and Gómez-León, “Annual and state-level data on U.S. total fertility rates, 1931–present,” which reconstructs annual U.S. TFR from Vital Statistics of the United States. The 2025 endpoint, 1.57, comes from the Wall Street Journal’s calculation using provisional CDC data.
Fig. B keeps 2025 from being misread as a short-term slump. The United States has been below the 2.1 replacement threshold since the early 1970s. The estimated 2025 total fertility rate, 1.57 births per woman, sits inside a decline that runs across decades, not election cycles. Recent pressures such as inflation, housing cost, and job insecurity are part of the story. Fig. B also shows that the decline is older than the present decade. The longer pattern points to changes in when adults form stable partnerships, when households feel financially ready for children, and how long education and career sorting now delay family formation
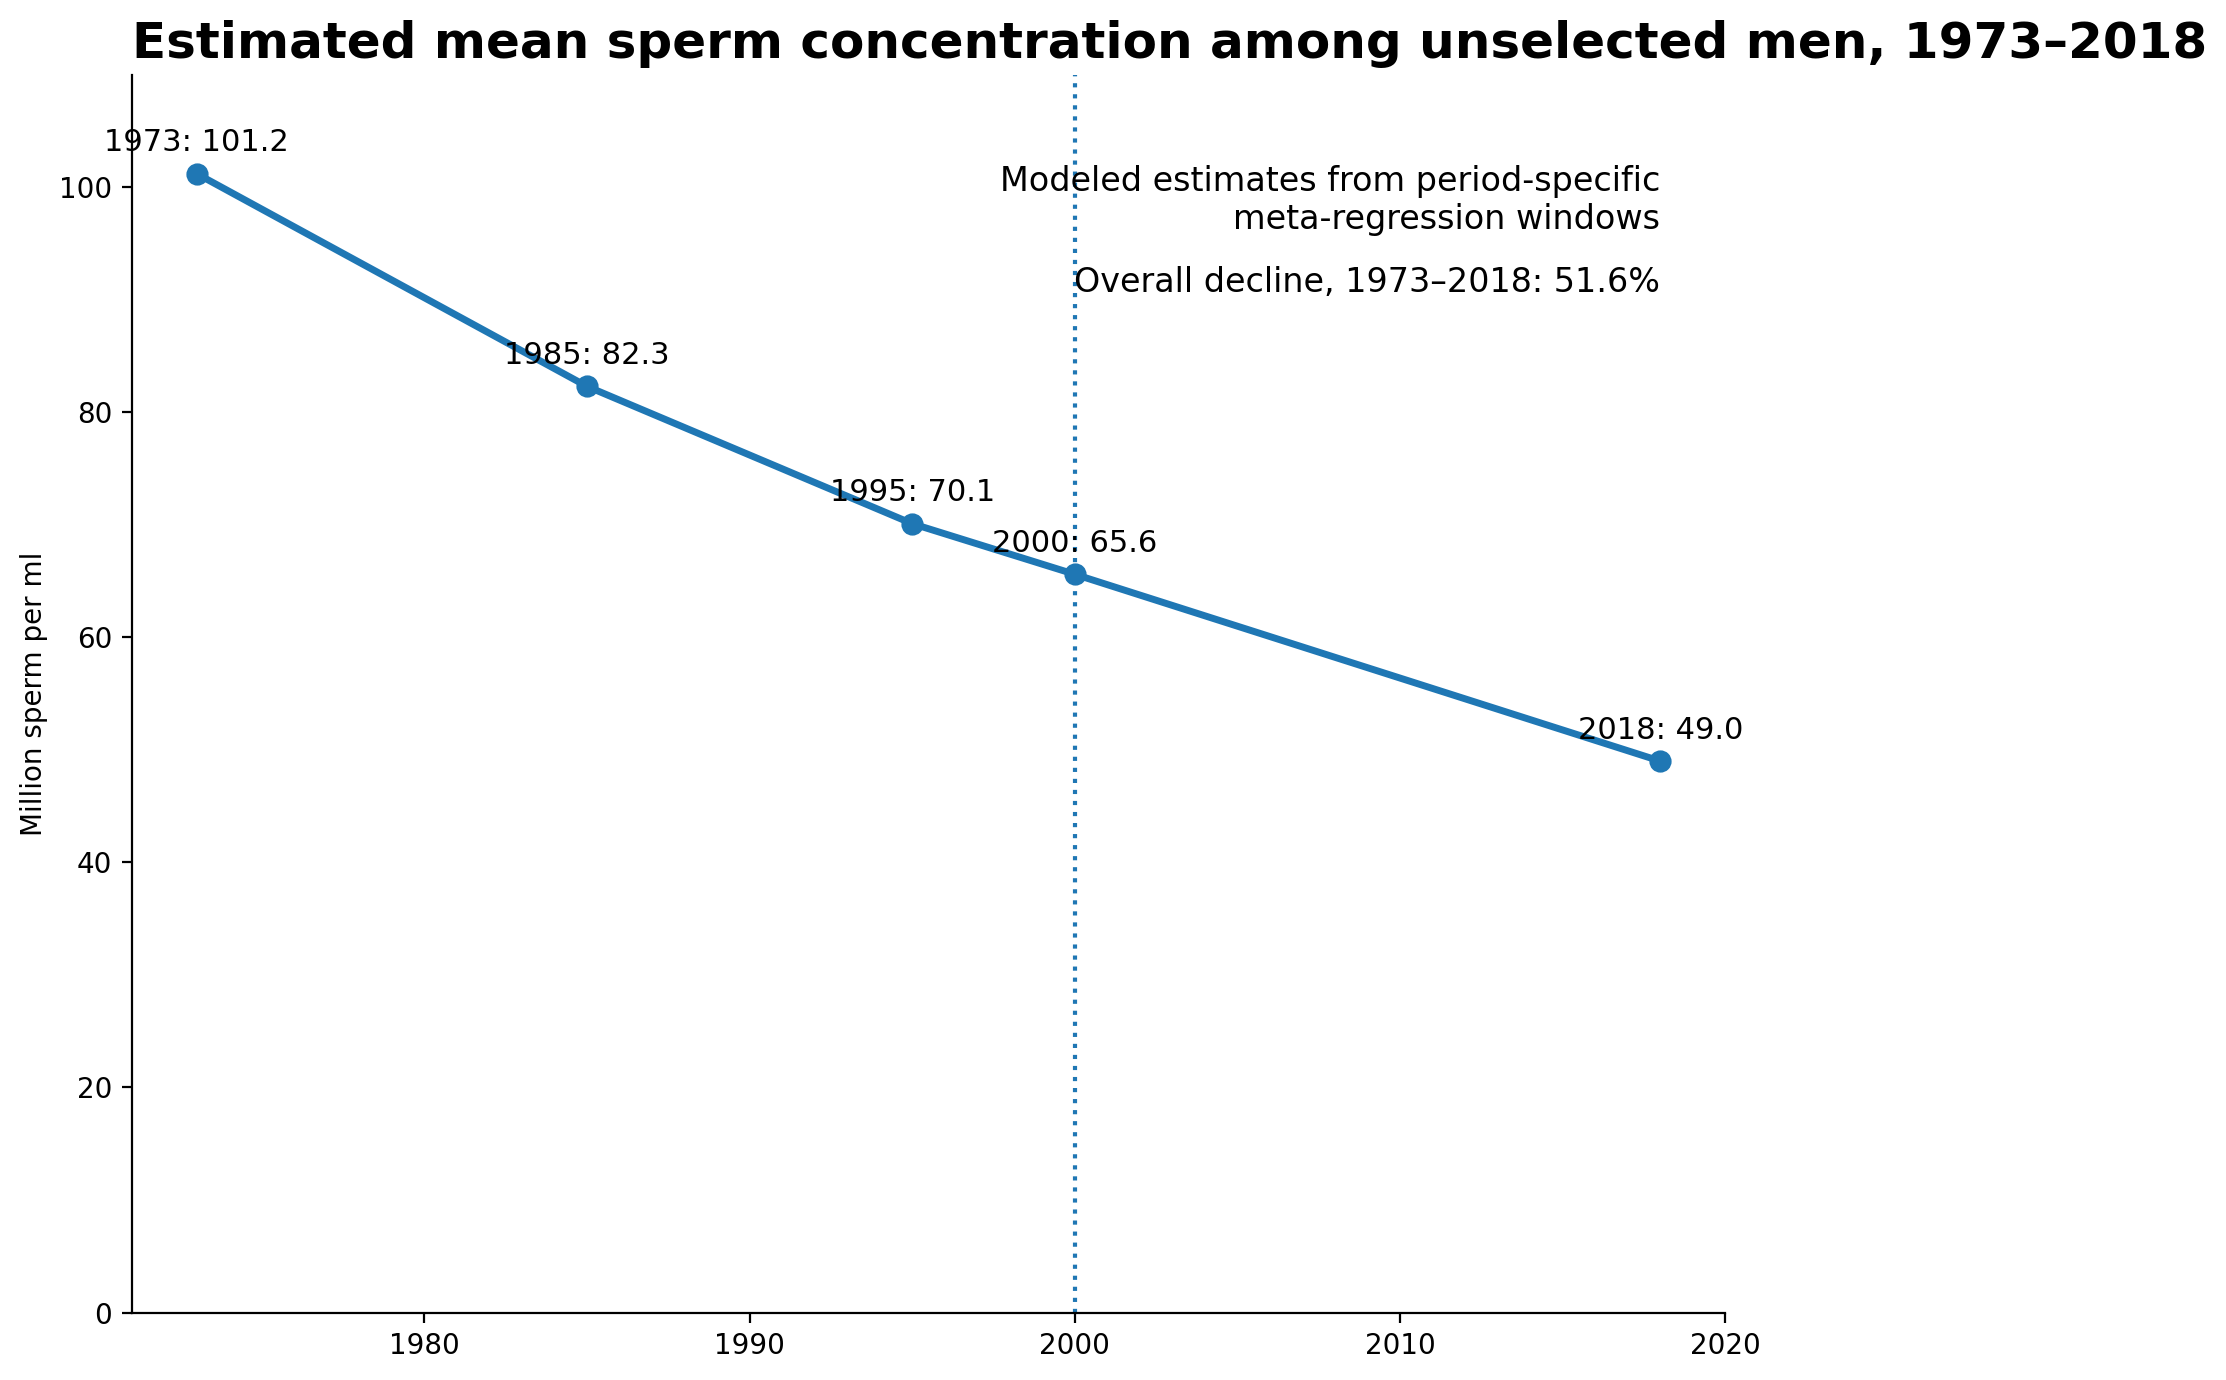
Fig. C. Estimated mean sperm concentration among unselected men, 1973–2018.
Source citation: Levine H. et al., “Temporal trends in sperm count: a systematic review and meta-regression analysis,” Human Reproduction Update, 2023. The five plotted values are taken from Table II and the overall 51.6% decline comes from the paper’s stratified meta-regression for unselected men.
Fig. C belongs in our work because public fertility coverage usually treats reproductive capability as a separate subject. Levine et al.’s 2023 meta-analysis estimated mean sperm concentration among unselected men at 101.2 million per milliliter in 1973, 82.3 in 1985, 70.1 in 1995, 65.6 in 2000, and 49.0 in 2018. That is not an official annual surveillance series. It is a modeled estimate drawn from a large body of studies. It still deserves attention. The figure does not support a straight causal line from sperm concentration to national birth trends. It does support a more limited point. Some couples may be attempting parenthood later, under tighter economic conditions, while male reproductive health is also weakening. Those conditions increase the difficulty of family formation rather than offsetting one another
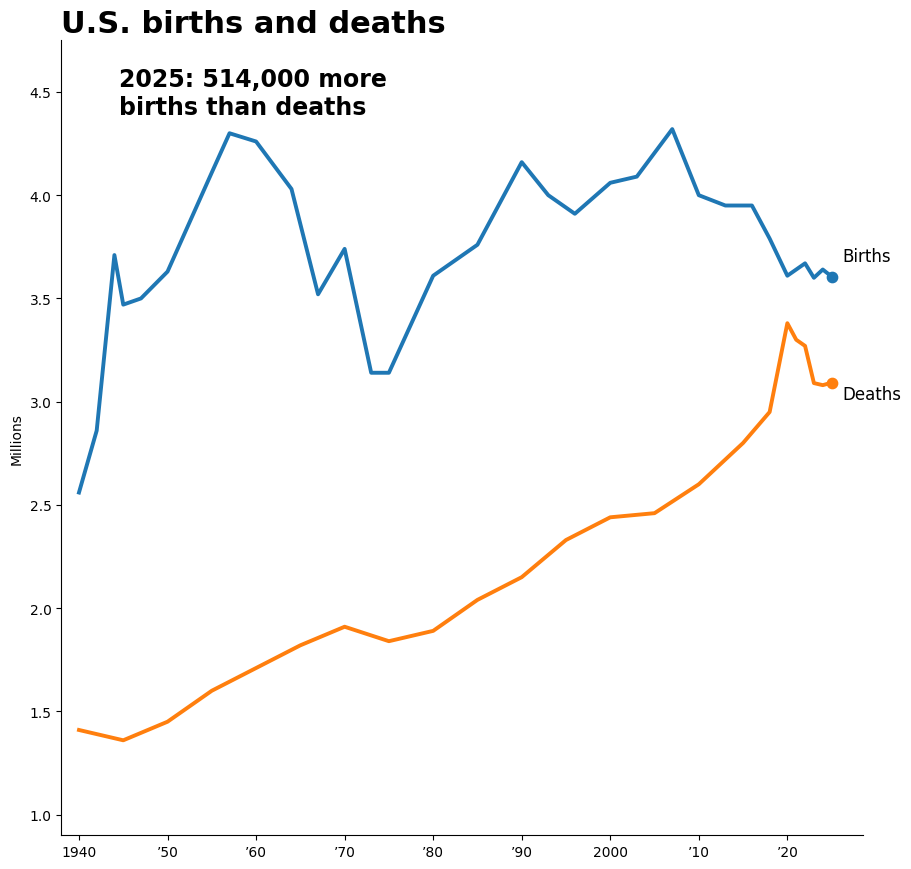
Fig. D. U.S. births and deaths, 1940–2025.
Source citation: 2025 endpoint grounded in CDC National Vital Statistics System provisional counts for births and deaths, with the 514,000 natural-increase framing matching the Wall Street Journal chart summary.
Fig. D shows the demographic consequence. In 2025, births still exceeded deaths in the United States, but only by about 514,000. That is still positive natural increase, but the margin is much smaller than it once was. As that margin shrinks, the effects move outward into labor-force replacement, pension systems, elder care, healthcare demand, and the fiscal balance of an aging society.”
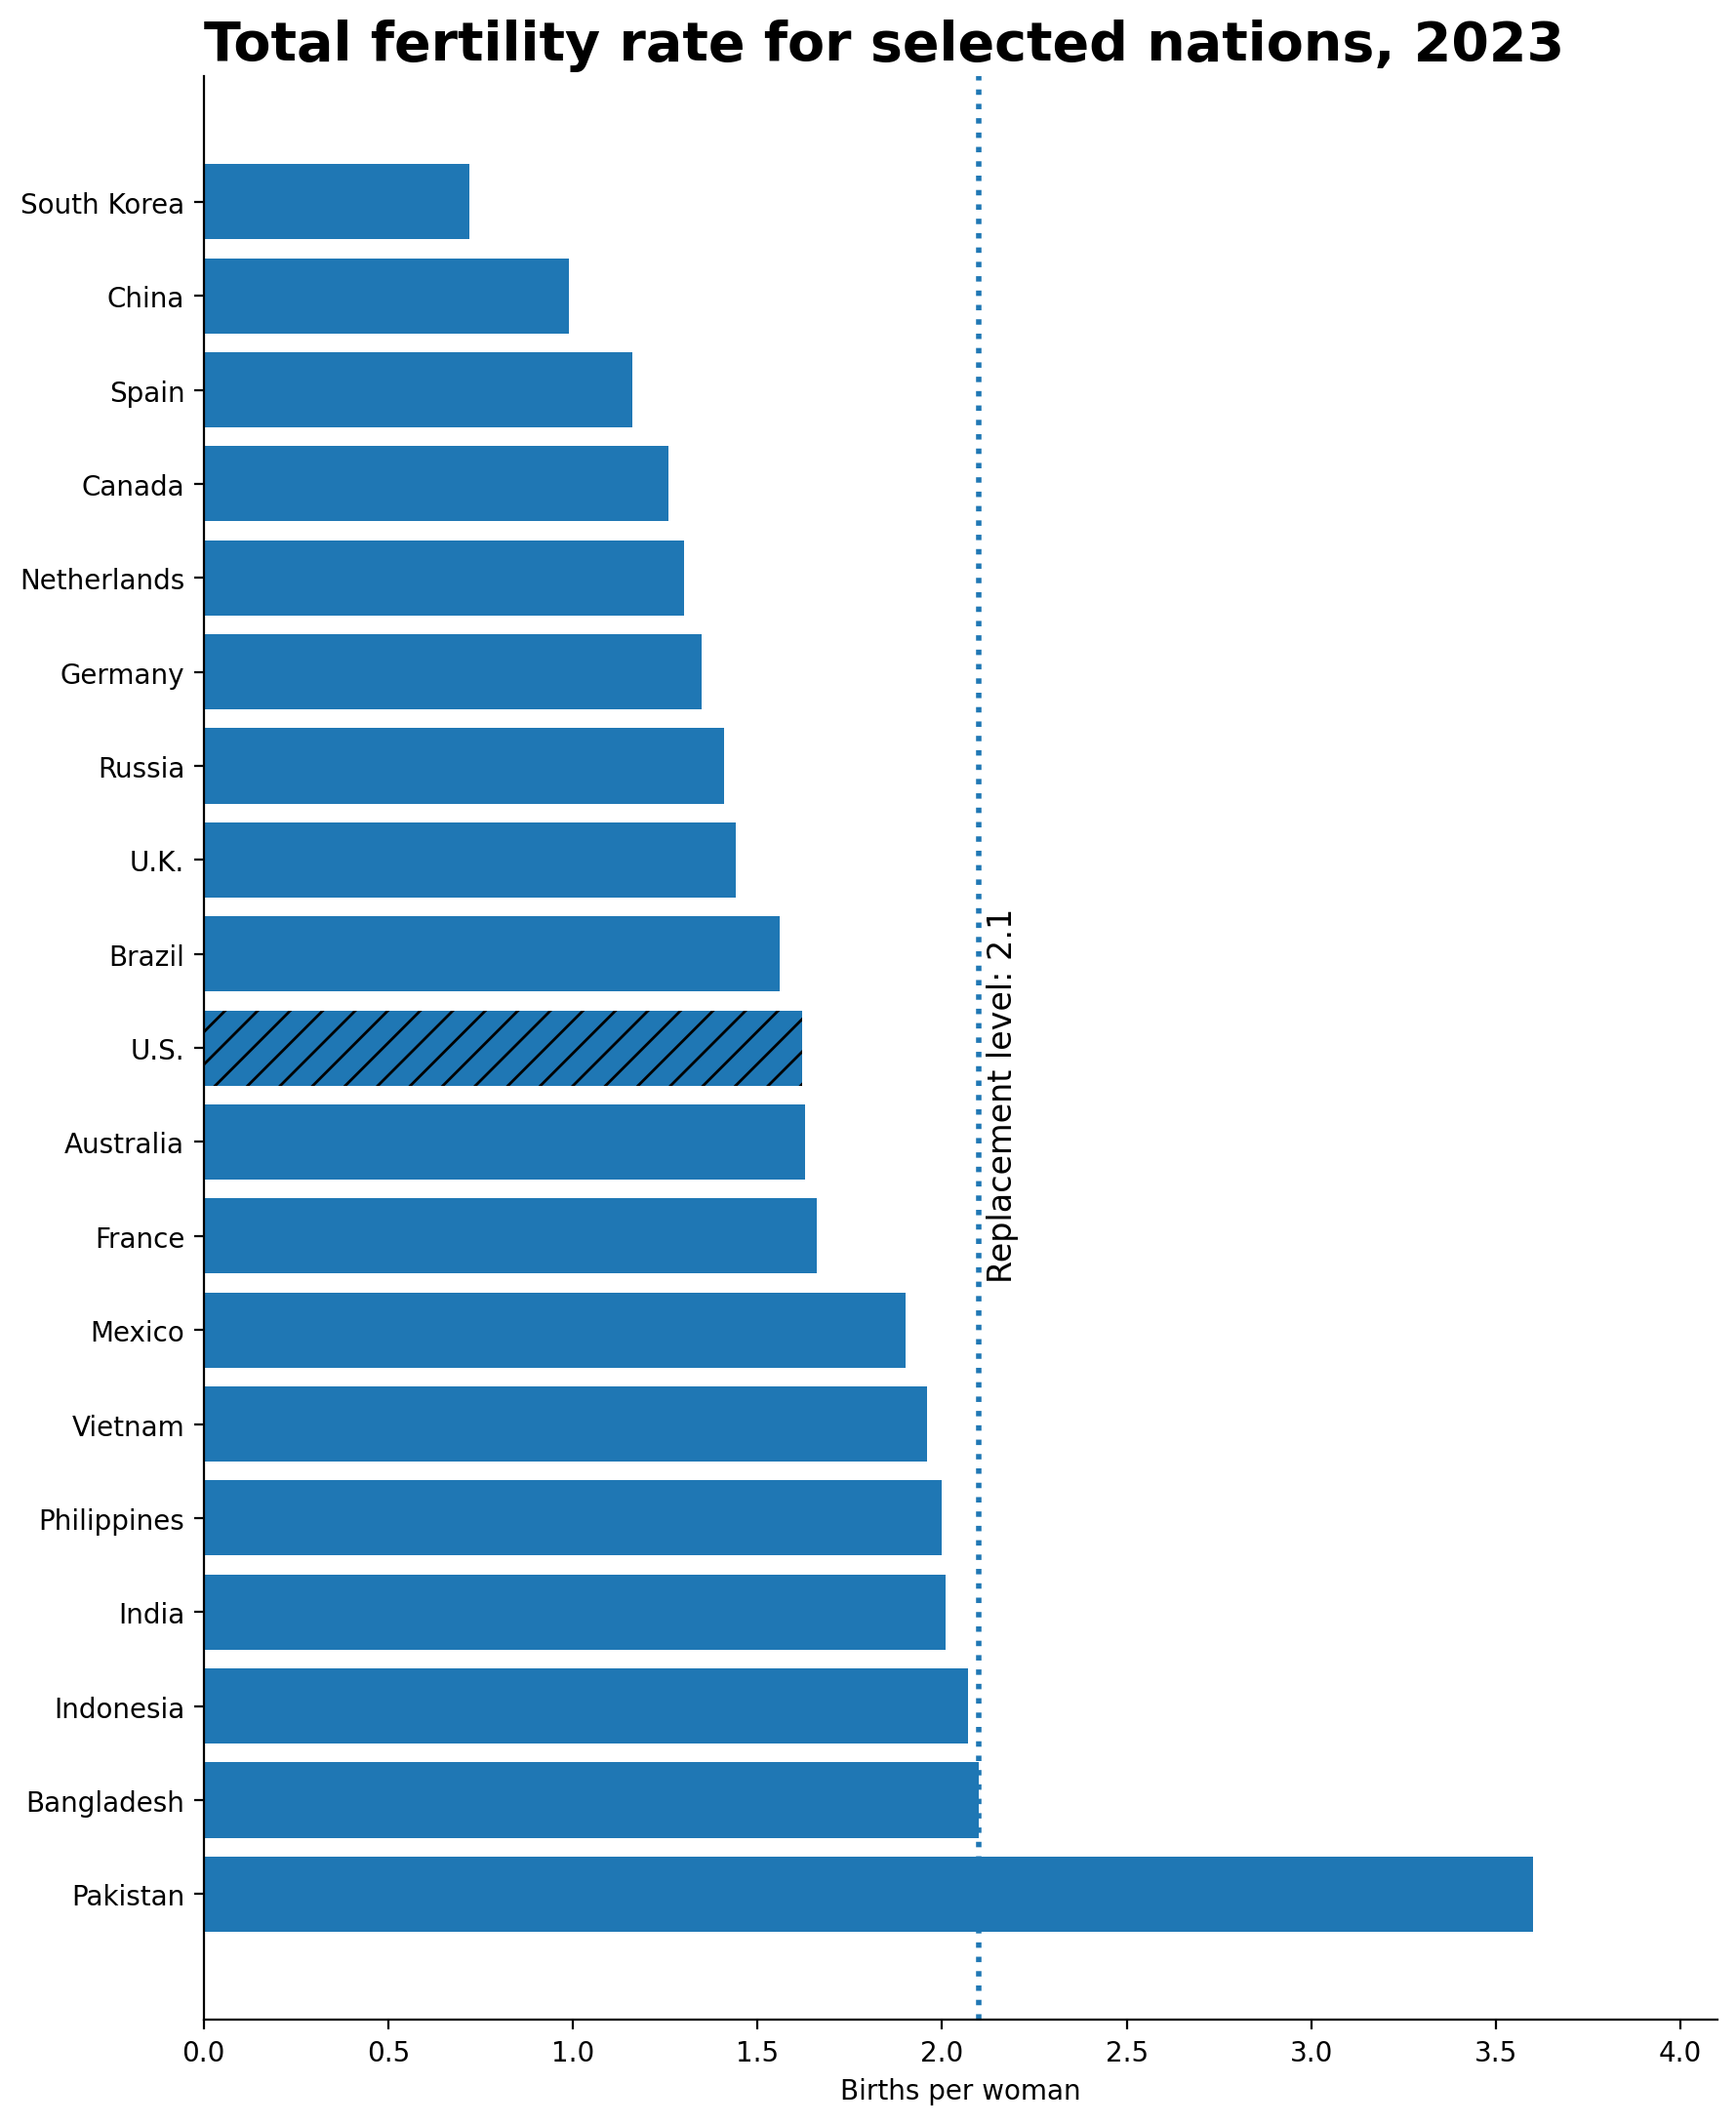
Fig. E. Total fertility rate for selected nations, 2023.
Source: Country comparison built against the World Bank total-fertility-rate indicator for 2023. This version is a recreation of the article’s selected-country graphic, so the country list, ordering, and bar lengths were matched to the screenshot rather than exported directly from the World Bank table one country at a time.
The questions worth carrying forward go beyond whether people are “choosing” to have fewer children.
How much weight belongs to housing, education cost, work structure, and urban concentration, and how much belongs to changing reproductive health?
Suppose the decline is partly social and partly biological. What follows from that? A serious response would have to reach far beyond campaigns to raise birth rates or one-time tax credits. It would have to touch housing, childcare, schooling, fertility screening, infertility treatment, work expectations, and the timing pressures that now compress parenthood into a shorter stretch of adult life.
How should lower birth rates be read in a world that is also moving toward longer lifespans, possible life extension, softer entry-level labor markets, and AI systems aimed at replacing or thinning large categories of work? It is possible these are separate developments. It is also possible they are beginning to act on each other inside the same social system.
If developed countries treat South Korea as the warning case, what would a responsible template look like for avoiding the institutional failure that people fear when they use phrases like collapse? Which mix of family policy, housing reform, labor-market design, immigration, fertility care, pension reform, and automation would preserve services, maintain state capacity, and keep the age structure from turning into a fiscal trap?
At what point does the discussion stop being about fertility in the narrow sense and become a broader question about how a society intends to reproduce itself at all, economically, biologically, and institutionally?