Before Efficiency Shows Up: A Note from Early Industrialization
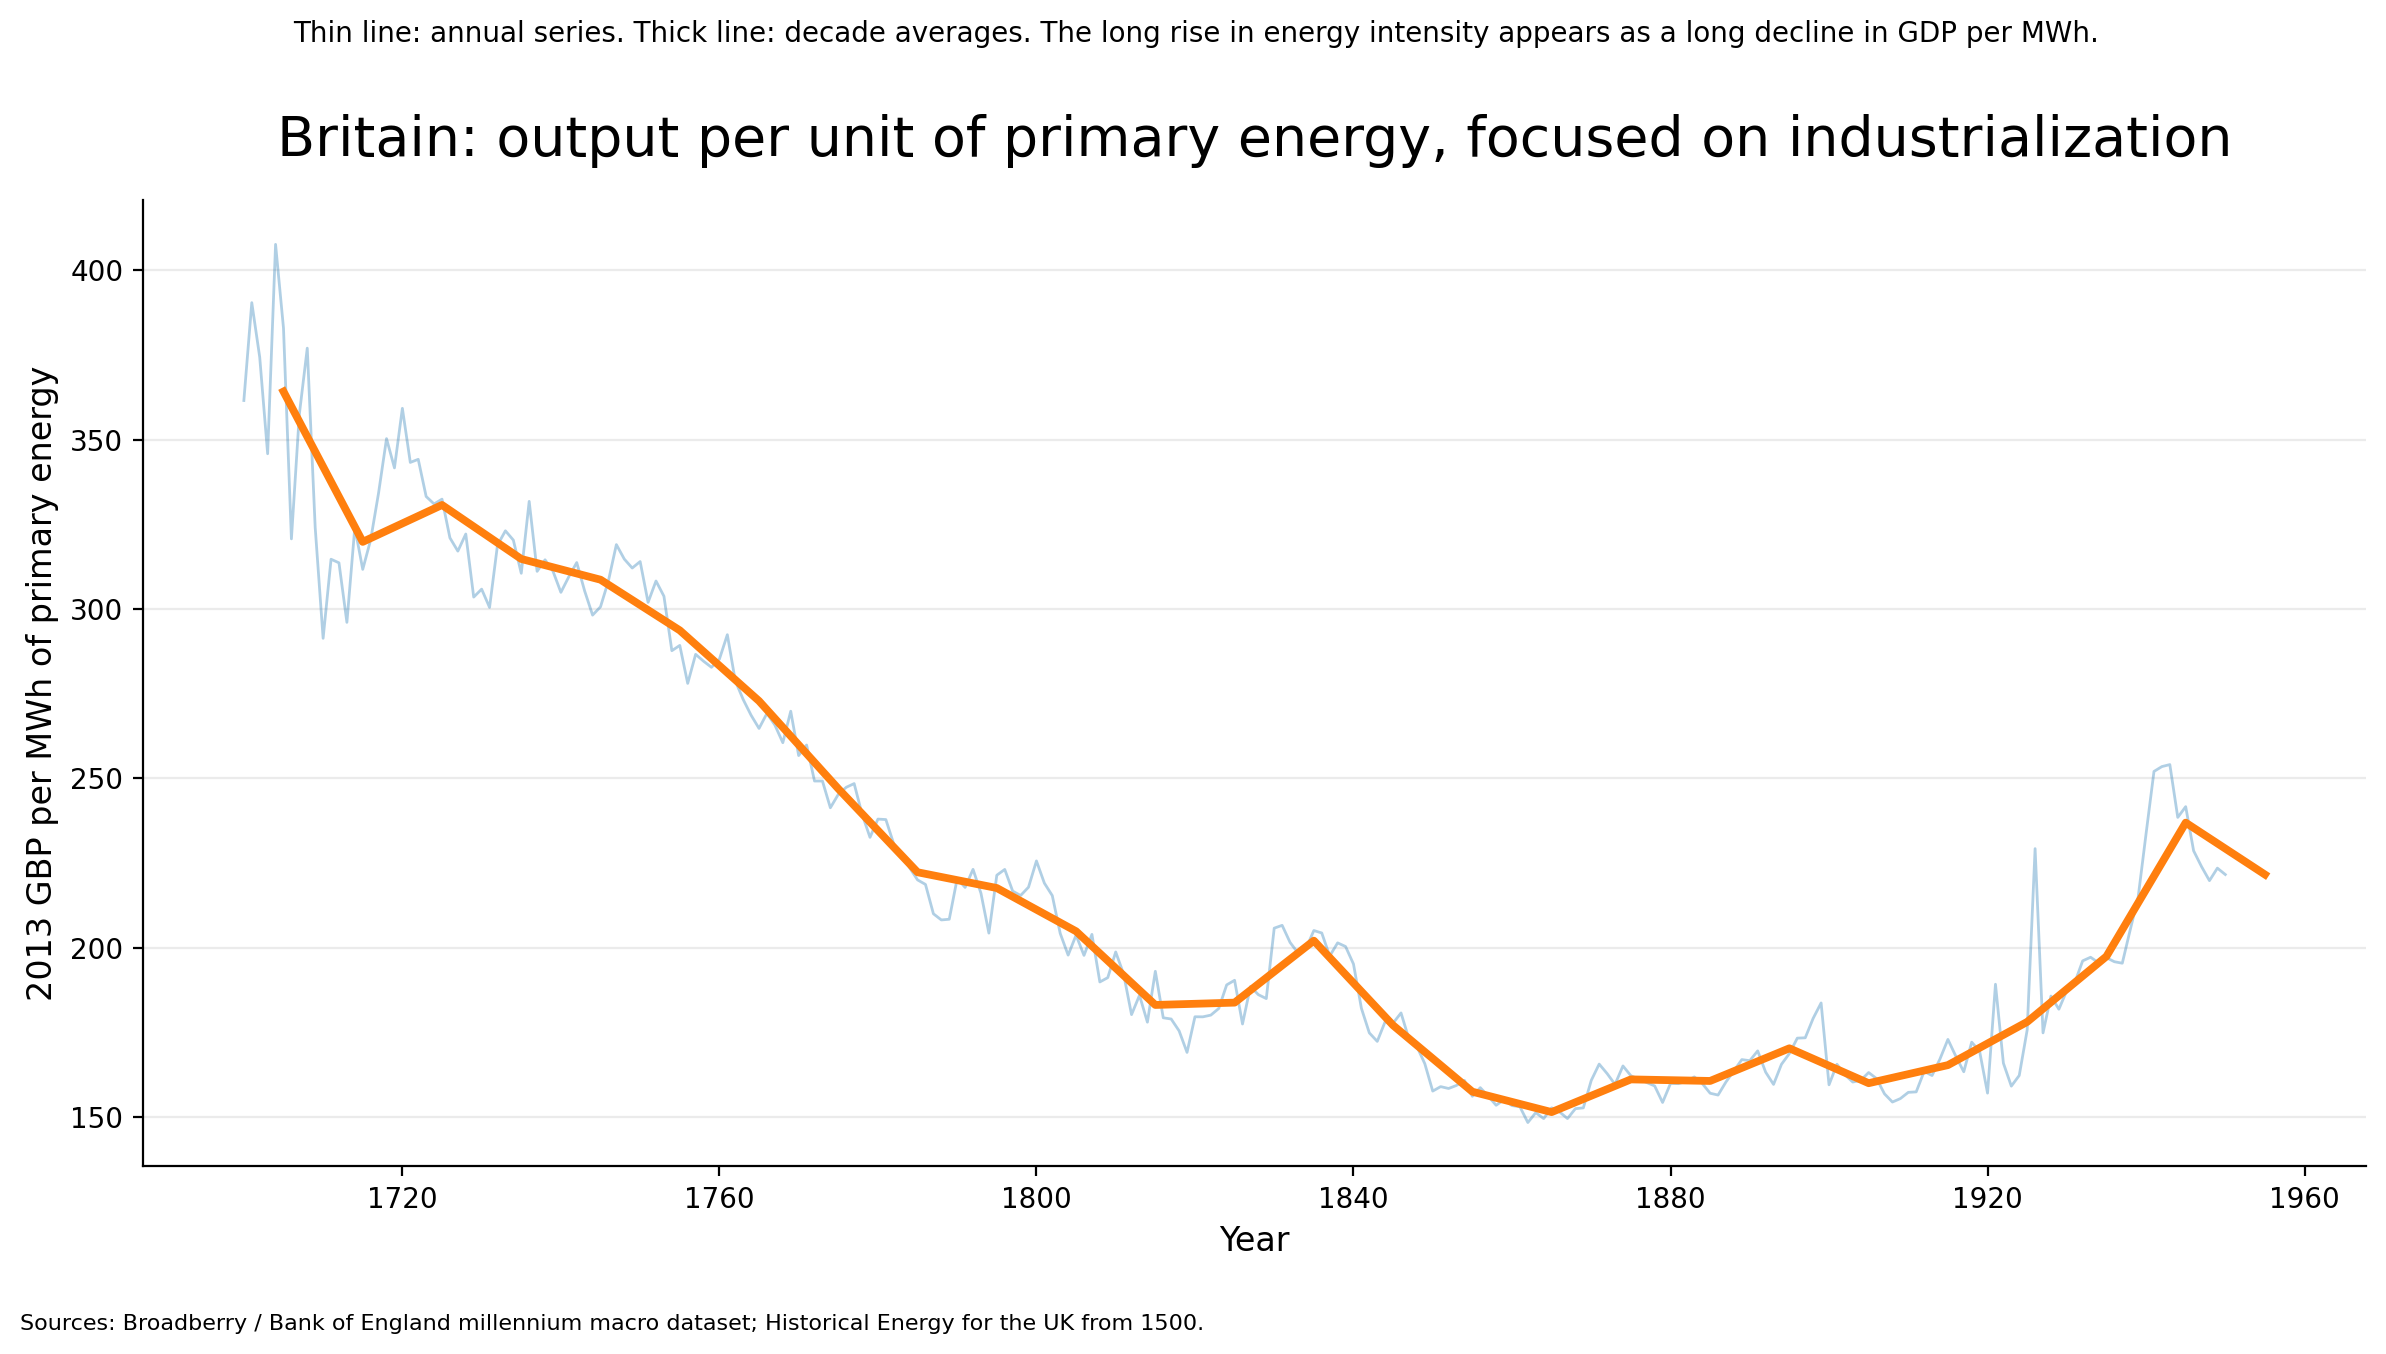
Figure A. Britain’s output per unit of energy, 1700–1950
Output per unit of primary energy falls through the long buildout of the industrial system, then begins to recover later. The early transition looks energy-hungry before it looks efficient.
What I was trying to test
While working on the AI data center piece, I kept wondering whether the Industrial Revolution showed a similar pattern. Something fairly specific. Did energy demand rise faster than output for a long stretch before that relationship started to reverse?
That became the working hypothesis. If a new general-purpose system takes time to mature, maybe the early phase looks energy-hungry before it looks efficient. I wanted to see whether Britain gave us a historical case of that pattern.
How I built the series
I I worked with ChatGPT to identify relevant data sources and figure out how to stitch them together into something usable.

Figure B. Britain: steam and rail as buildout proxies, 1700–1950
The solid line shows steam-engine coal as a share of Britain’s primary energy system, using the left axis. The dashed line shows rail passenger journeys, using the right axis. Read together, they give a rough view of two different parts of the industrial buildout: steam rising inside the energy base, then rail diffusing as a mass network in the nineteenth and early twentieth centuries. The rail series comes from a Wikimedia Commons dataset page that cites ATOC’s Billion Passenger Railway for 1830–2001 and ORR Table 1220 for 2002 onward.
For GDP, I used Broadberry and van Leeuwen’s annual Great Britain reconstruction for 1700 to 1870. They describe it as the first annual GDP series for Great Britain over that period, built from the output side using annual volume indicators and value-added weights. For energy, I pulled in the Fouquet long-run UK energy data so the denominator could be total primary energy rather than coal tonnage alone. I still kept coal in view, since it matters to the story, but I did not want the whole note resting on one fuel.
What the series seems to show
Figure A. reflects that on a total primary energy basis, Britain’s output per unit of energy falls for a long stretch before it rises. For much of the transition, energy input is growing faster than output. The early phase does not read like an immediate efficiency win.
That lined up better with the literature than I expected. Nuvolari, Verspagen, and von Tunzelmann note that steam made only a modest contribution to aggregate productivity growth until at least the 1830s, even while still playing a fundamental long-run role by changing Britain’s energy budget and opening access to fossil fuel stocks. Steam was important, but the gains took time to show up.
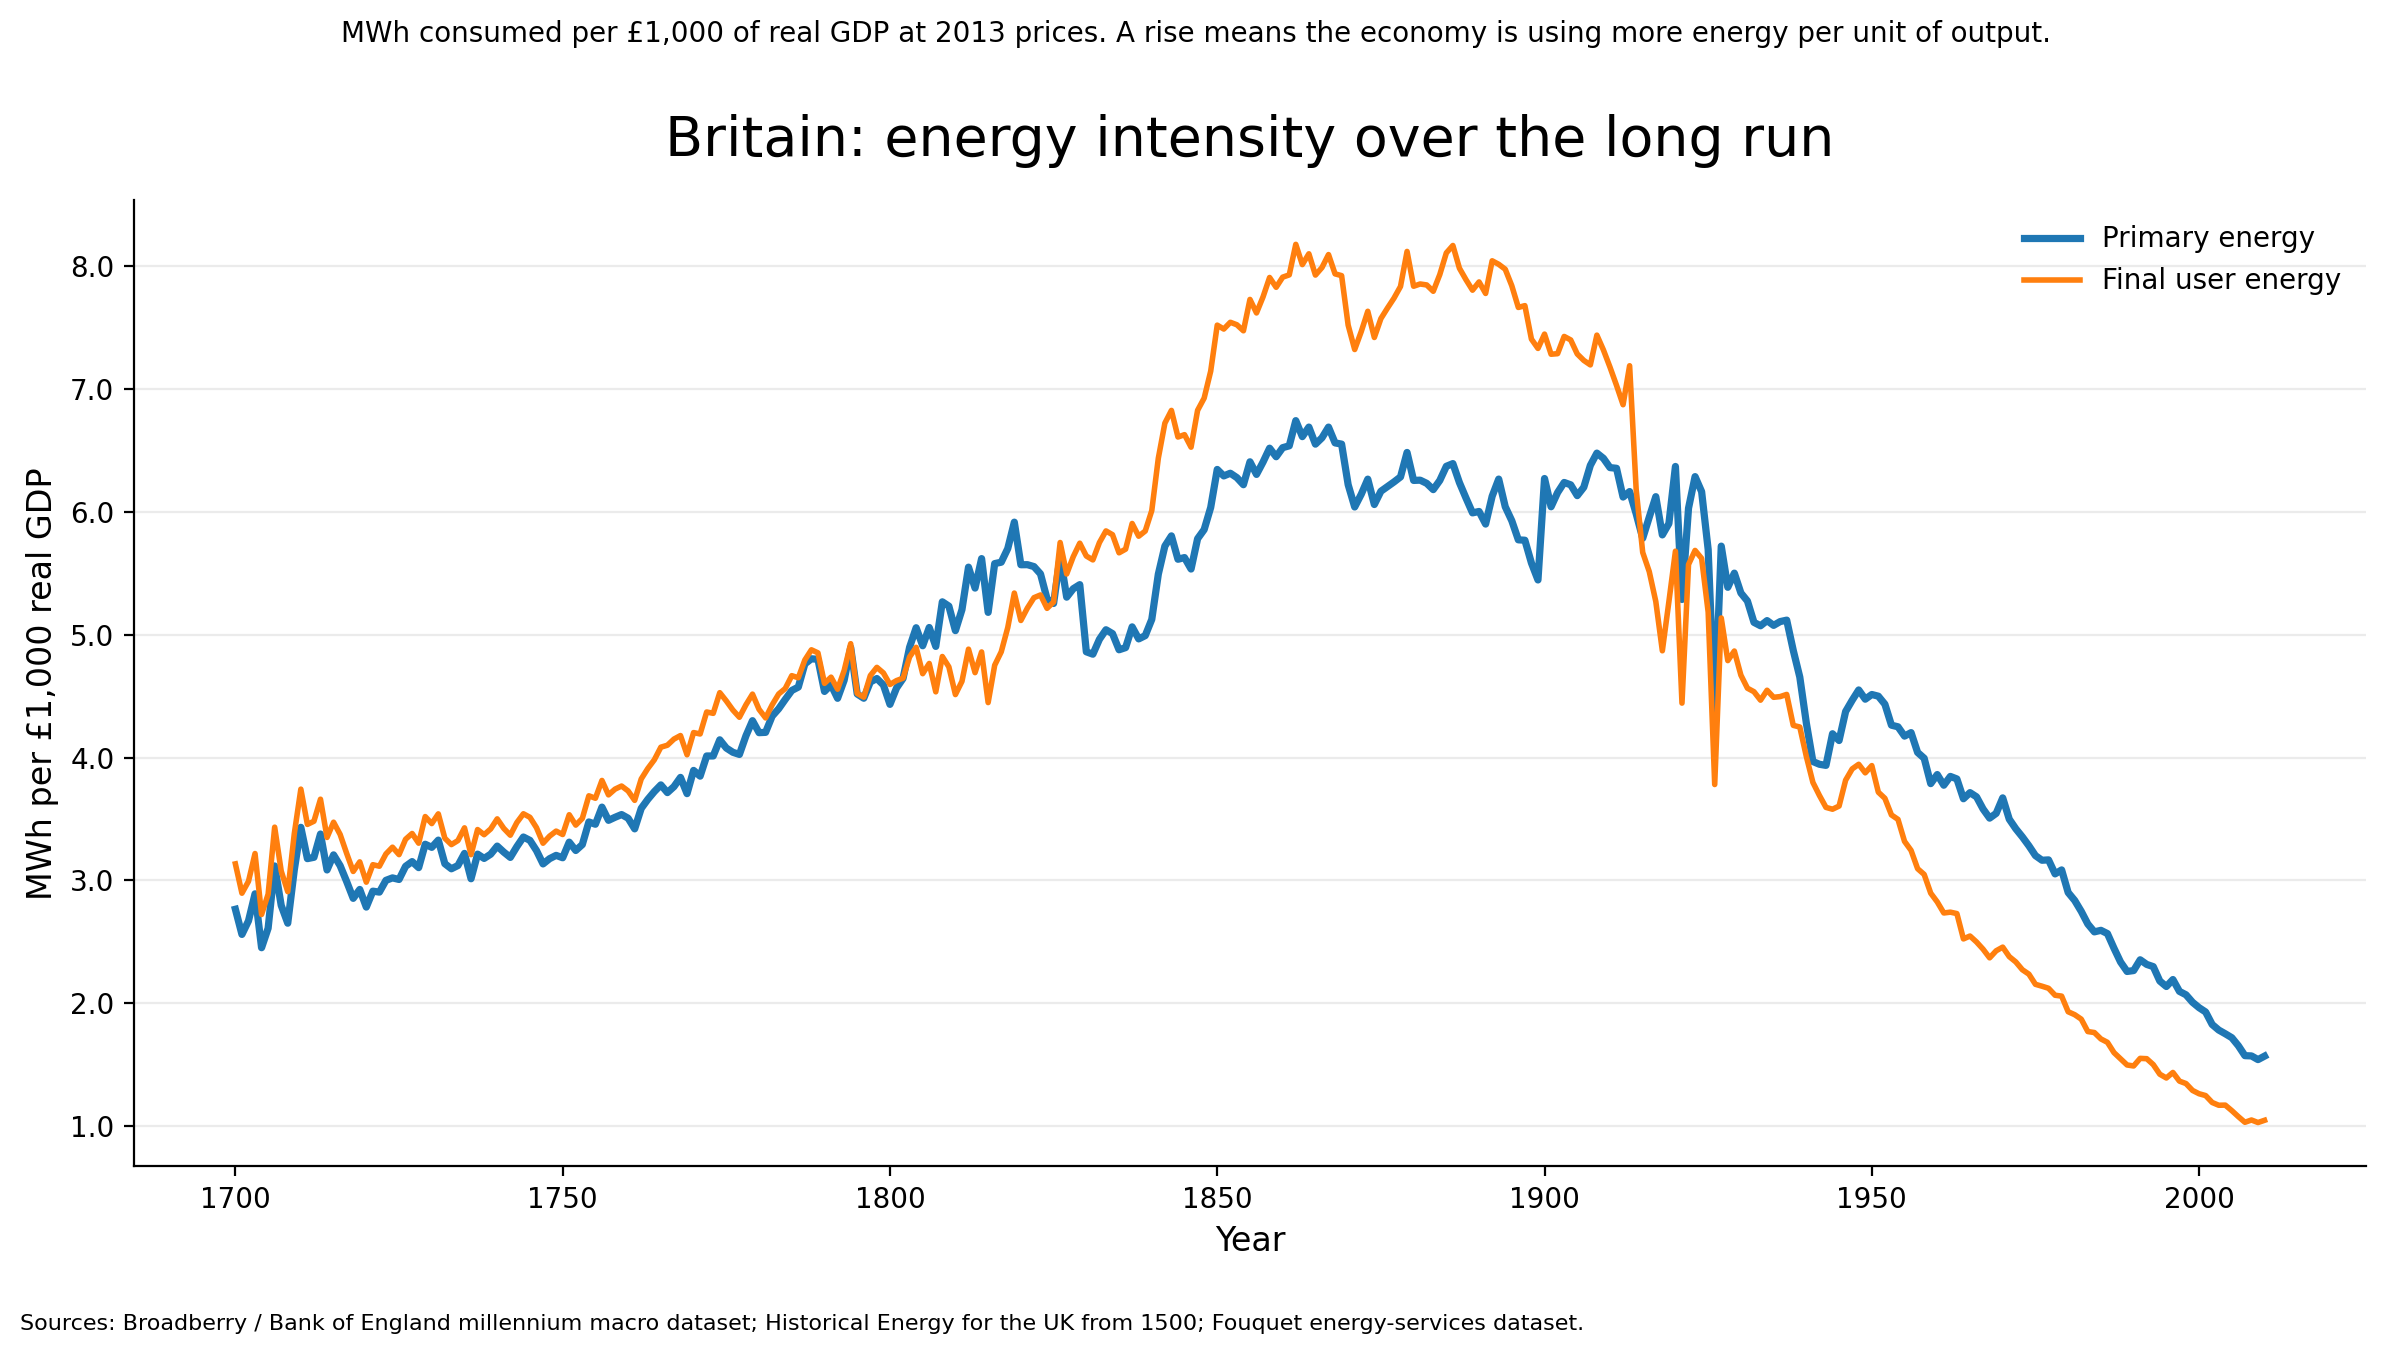
Figure C. Primary and final energy intensity in Britain, 1700–2010.
This chart compares two ways of looking at energy use relative to GDP. Primary energy includes energy in raw form before conversion losses, while final energy is the energy delivered to end users. Reading them together helps show that the story depends in part on what exactly is being counted in the denominator.
What makes the early decline less strange
One thing that helped me stop misreading the chart was getting more concrete about the pre-industrial economy. It is easy to picture 1700 as a relatively still baseline and then imagine industry arriving all at once. The data do not really support that. Broadberry’s agricultural reconstruction explicitly subtracts grain used to feed working animals and notes that oats were increasingly being used as horse fodder.
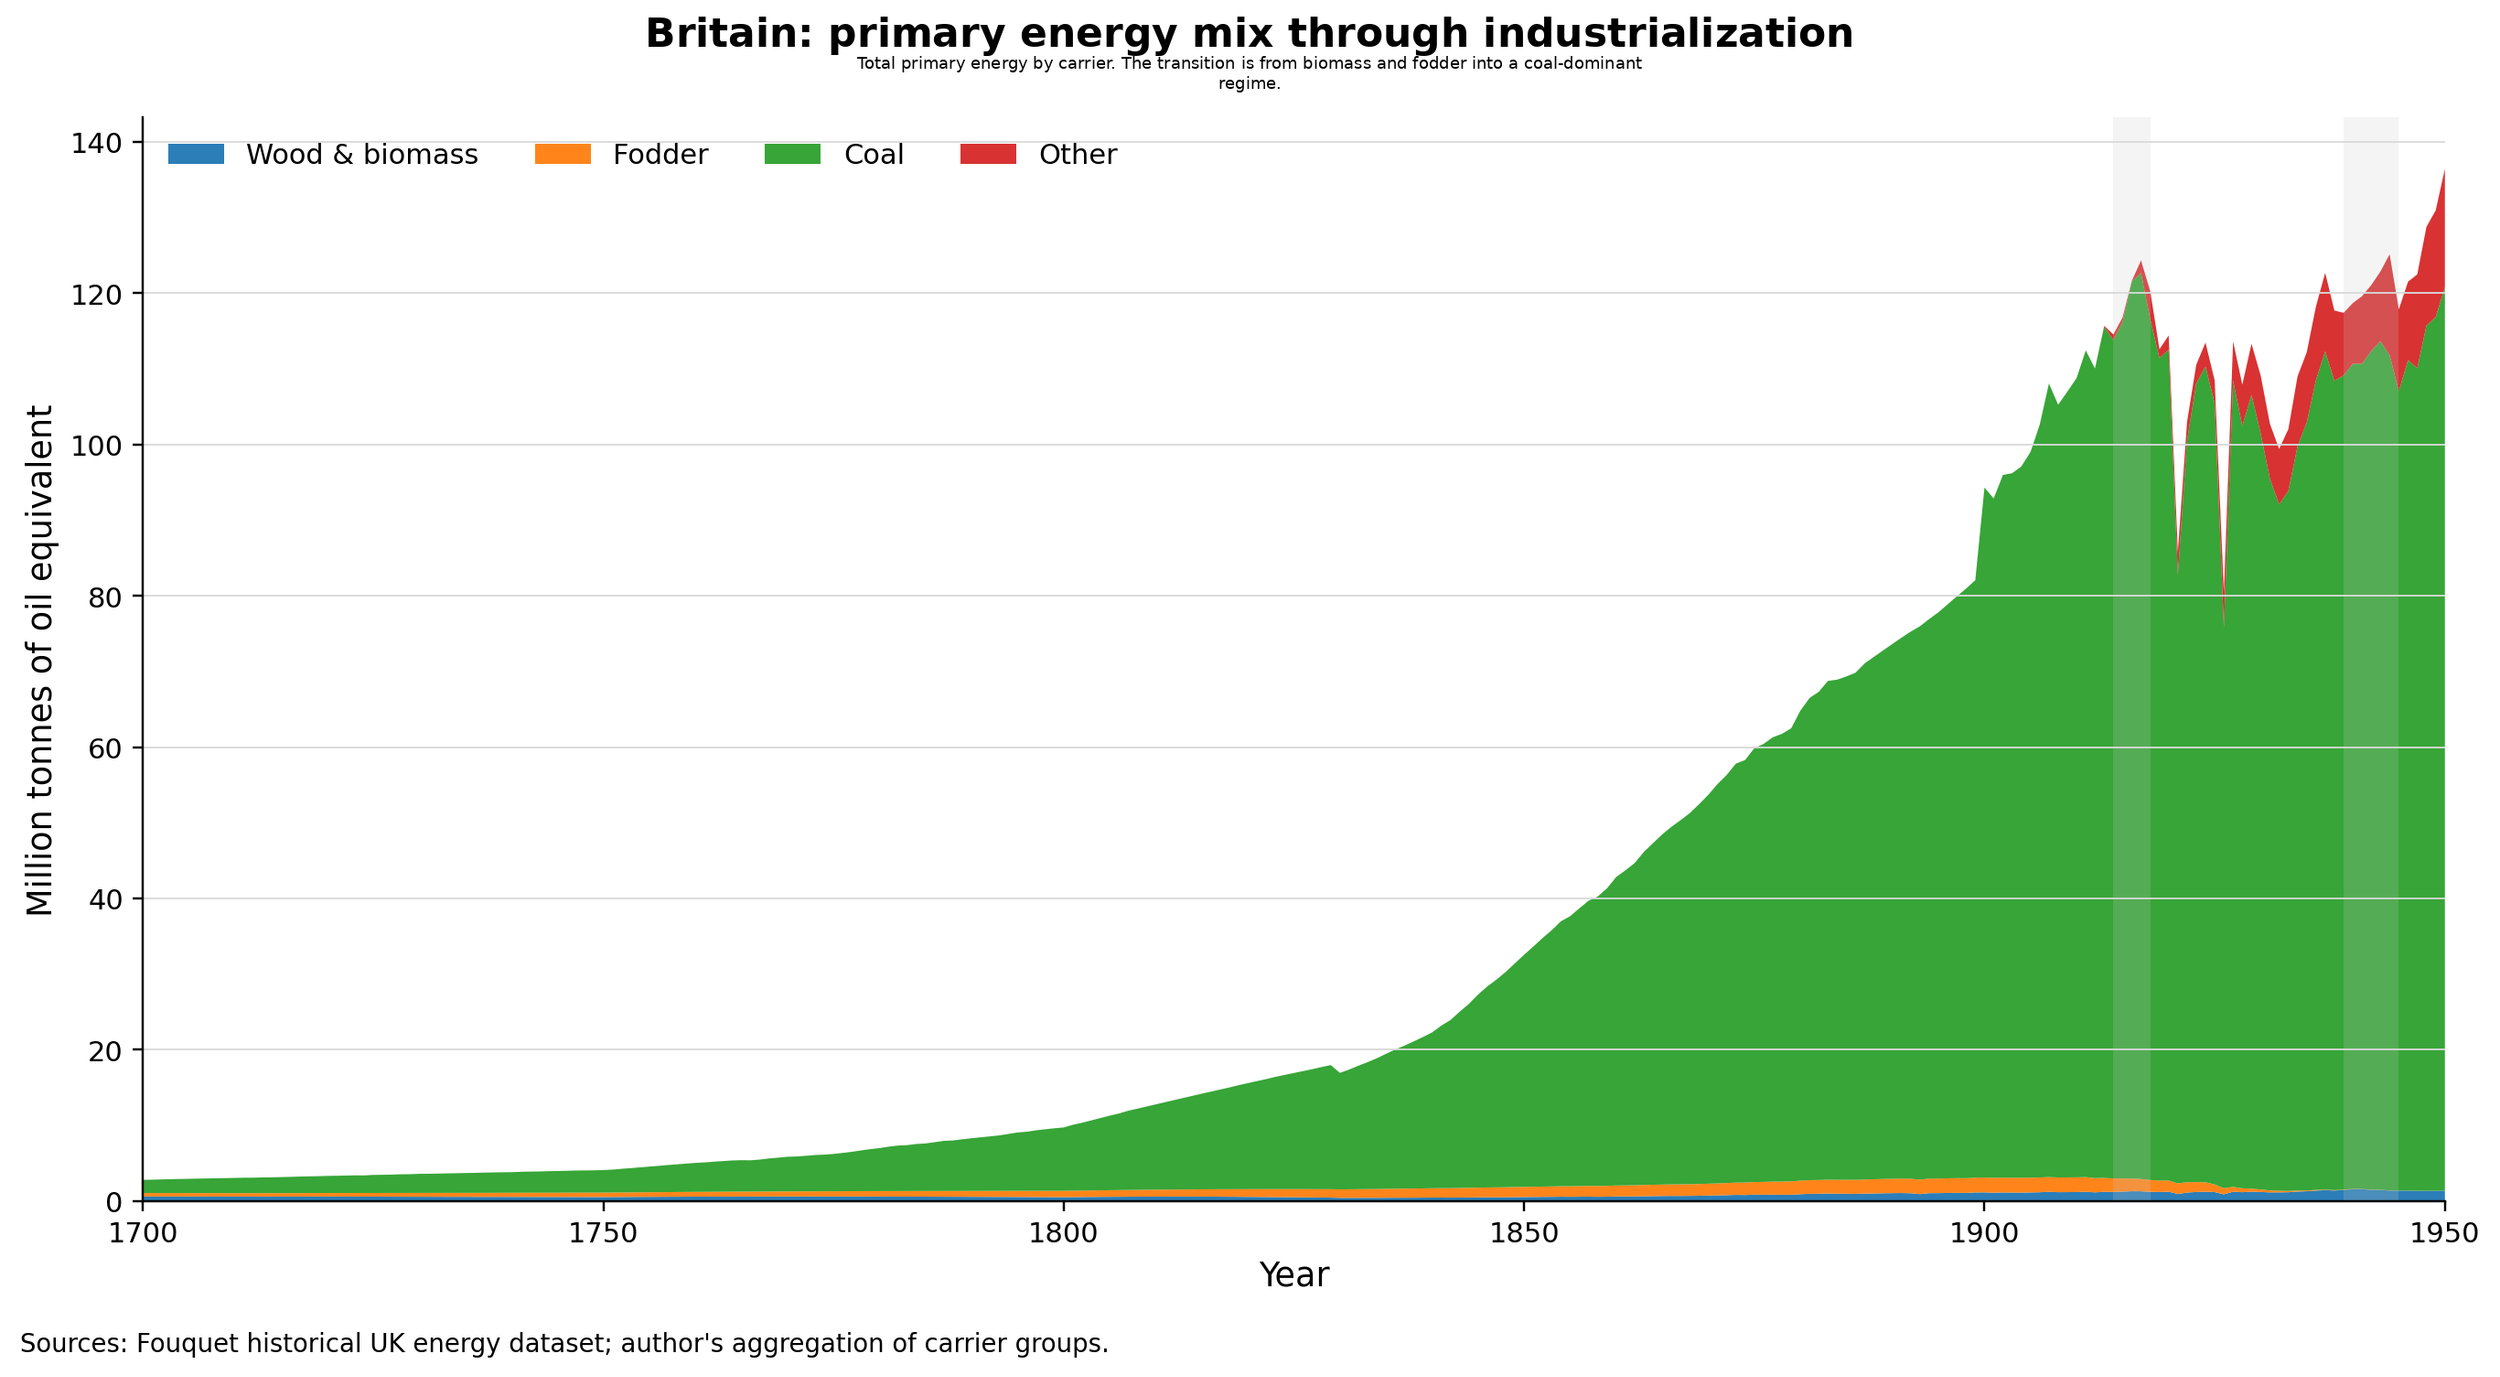
Figure D. Britain’s changing energy mix, 1700–1950.
This chart shows the composition of Britain’s primary energy supply over time. In the earlier period the energy system includes biomass, fodder, and other older sources, then coal becomes dominant as industrialization deepens. It gives context for Figure A by showing that the denominator is not a single stable fuel but a changing energy regime.
That explains the feel of the early part of the chart. Before the classic factory phase, Britain was already using more energy through agriculture, draft power, transport, mining, and heating. Then coal, steam, iron, and transport scaled on top of that. Broadberry also shows industrial output growth accelerating from around 1740 to 1840, with especially rapid growth in mining, building, and metals. If the economy is reorganizing around mines, furnaces, engines, transport, and urban fuel demand, a long stretch where energy rises faster than output starts to look like the transition following a new paradigm.
How I’m reading it
My read, at least for now, is that Britain spends a long stretch expanding its energy base faster than it improves output per unit of energy. That happens first through a more intensive organic economy, then through coal, steam, metals, and transport. Energy use scales up before output per unit of energy improves.
I do not think that settles much about AI data centers. But it makes the parallel more credible. New general-purpose systems can absorb a lot of energy before they get visibly better at turning that energy into output. The later gains may still come. They just may not show up early or in a clean line.
Sources
Broadberry, Stephen, and Bas van Leeuwen. 2010. “British Economic Growth and the Business Cycle, 1700–1870: Annual Estimates.” CAGE Online Working Paper Series, University of Warwick. https://warwick.ac.uk/fac/soc/economics/research/workingpapers/2010/twerp_949.pdf
Broadberry, S. N., B. M. S. Campbell, A. Klein, M. Overton, and B. van Leeuwen. 2015. British Economic Growth, 1270–1870. Cambridge: Cambridge University Press. https://www.cambridge.org/core/books/british-economic-growth-12701870/FC571CC476BC8B703AEB77D0B25D7FAD
Fouquet, Roger. Historical energy for the UK from 1500. LSE Grantham Research Institute. https://www.lse.ac.uk/granthaminstitute/publication/historical-energy-for-the-uk-from-1500/
Fouquet, Roger. Data set on the consumption of energy and energy services (1700–2010). LSE Grantham Research Institute. https://www.lse.ac.uk/granthaminstitute/publication/data-set-on-the-consumption-of-energy-and-energy-services/
Nuvolari, Alessandro, Bart Verspagen, and Nick von Tunzelmann. 2011. “The Early Diffusion of the Steam Engine in Britain, 1700–1800: A Reappraisal.” Cliometrica 5: 291–321. https://link.springer.com/article/10.1007/s11698-011-0063-6
Wikimedia Commons rail passenger dataset page used for the rail proxy: https://commons.wikimedia.org/wiki/File:GBR_rail_passengers_by_year_1830-2023.png